I’m an award-winning web developer and data journalist based in Toronto. I specialize in helping small newsrooms achieve big ambitions: building news apps and visual stories, and transforming editorial workflows with custom CMS tools.
I’ve been on staff at The Investigative Journalism Foundation, Global News, and The Trace. My work has also been published in The New Yorker, USA TODAY, and FiveThirtyEight.
Want to work together? Get in touch with me at dnlnss@gmail.com.
Portfolio
Publications
Technologies
Roles
2026
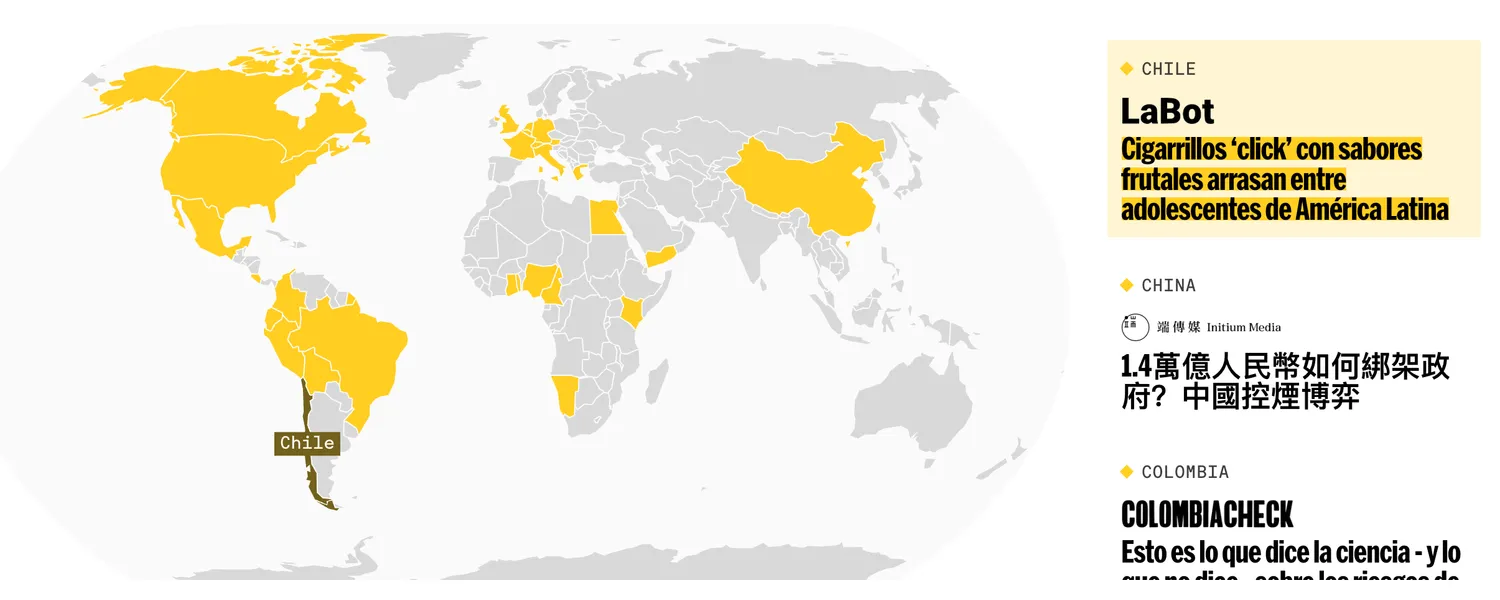
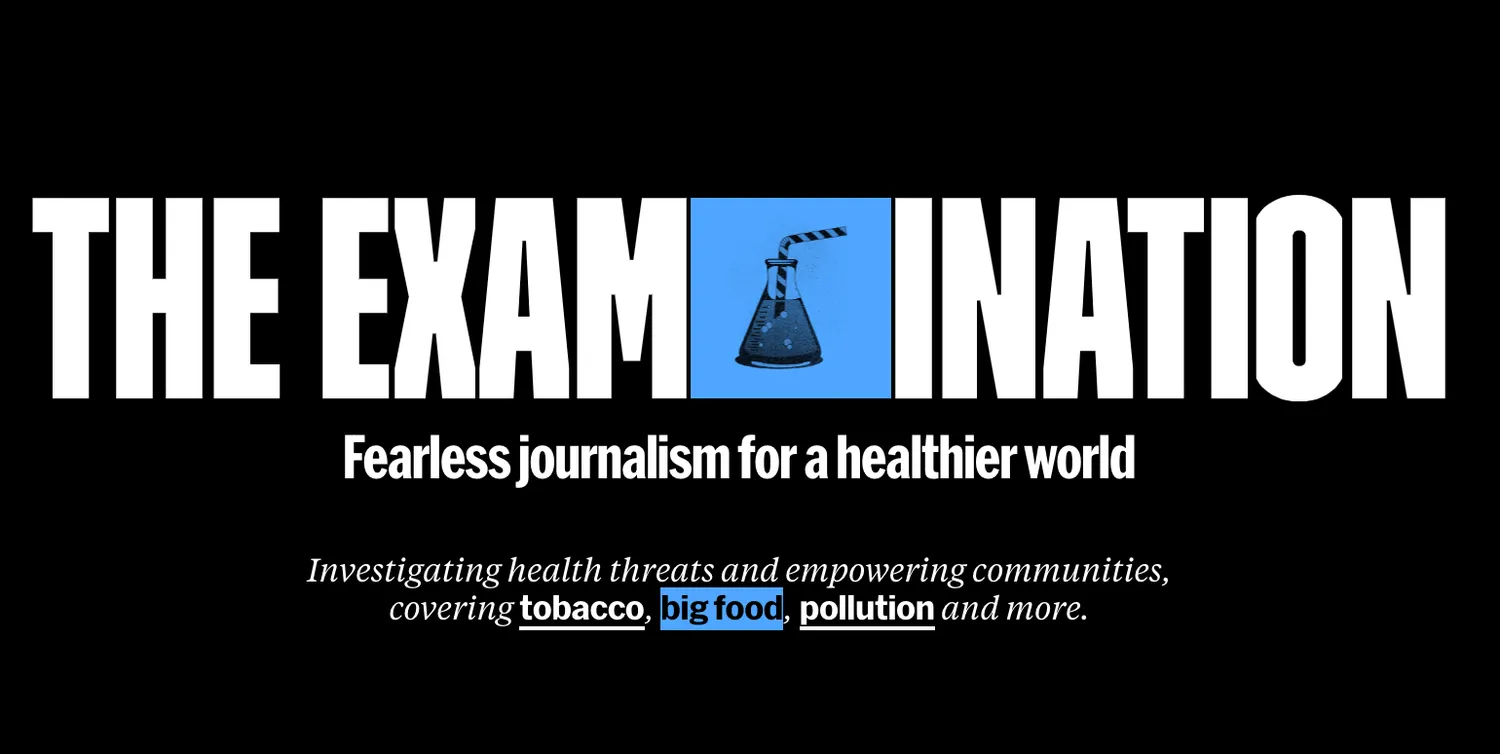
The Examination
Partnership Map
D3
Next.js
Storyblok
Design
Development
2025
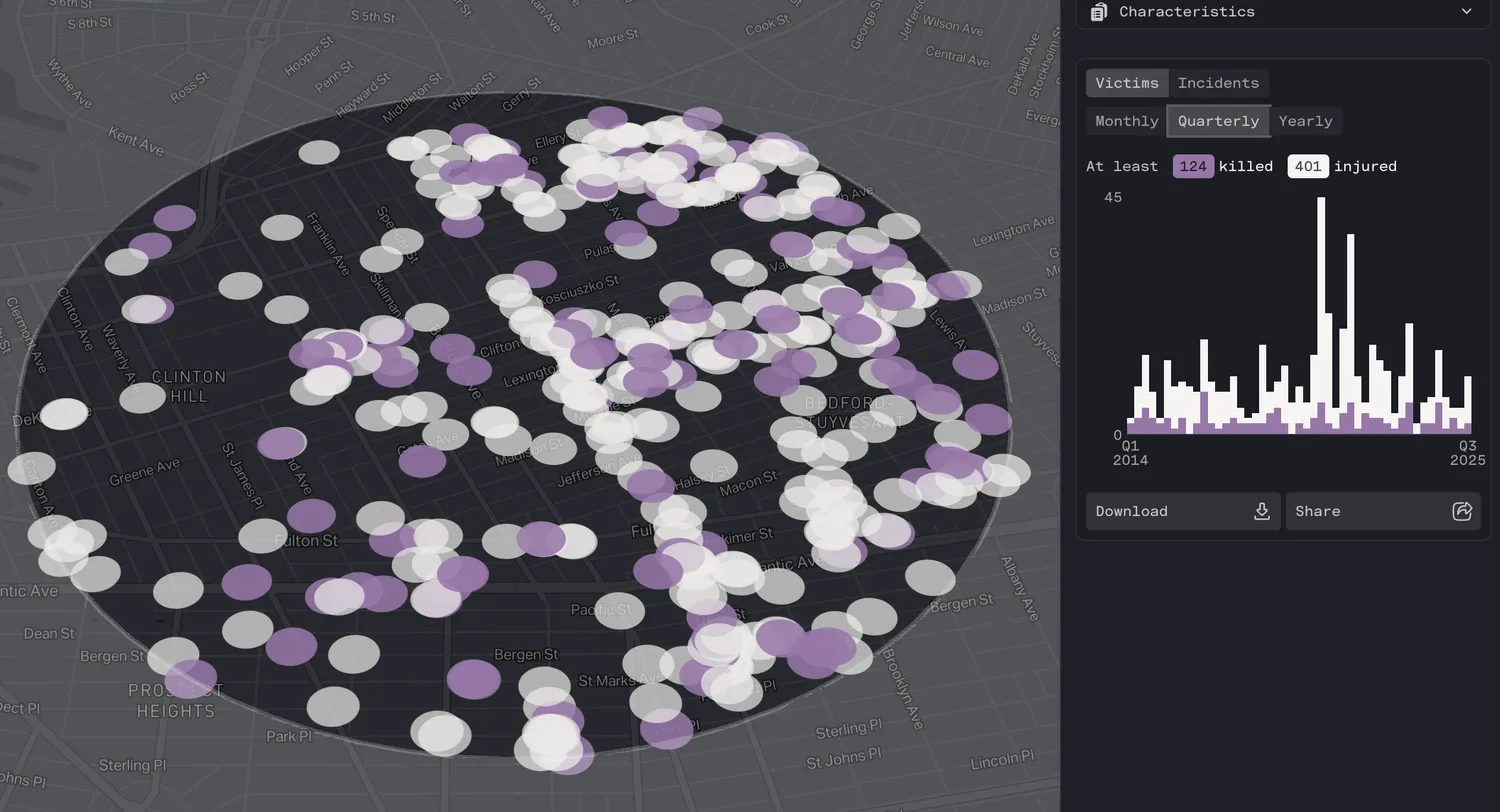
The Trace
Atlas of American Gun Violence
Deck.gl
Mapbox
Next.js
Data analysis
Design
Development
Mapping
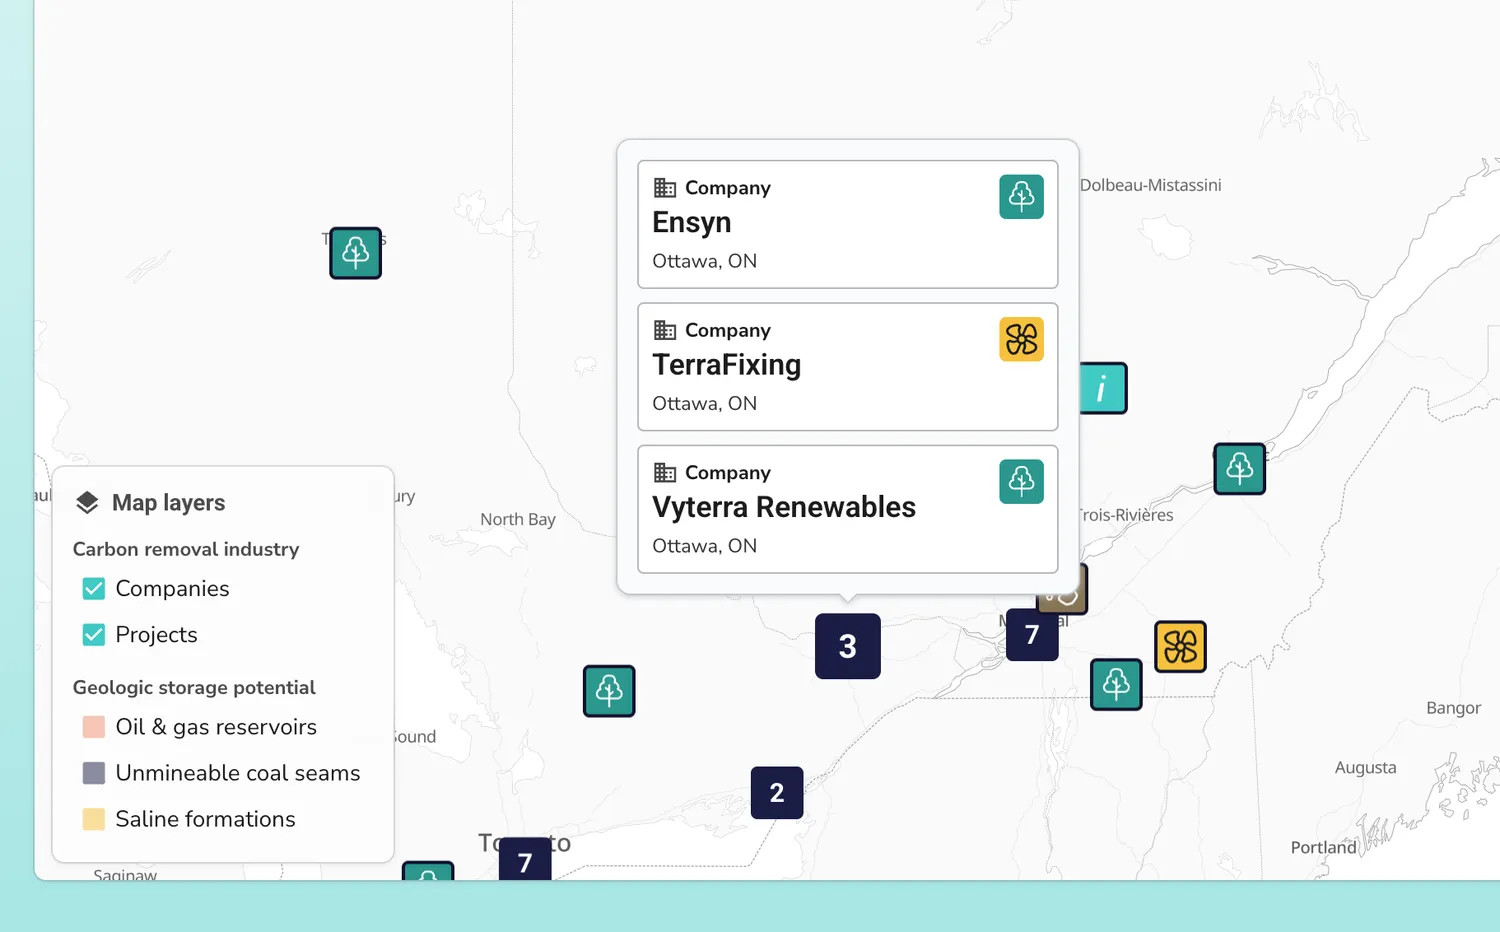
Carbon Removal Canada
Carbon Console
Airtable
D3
MapLibre
Svelte
SvelteKit
Dataviz
Design
Development
Mapping
Project strategy
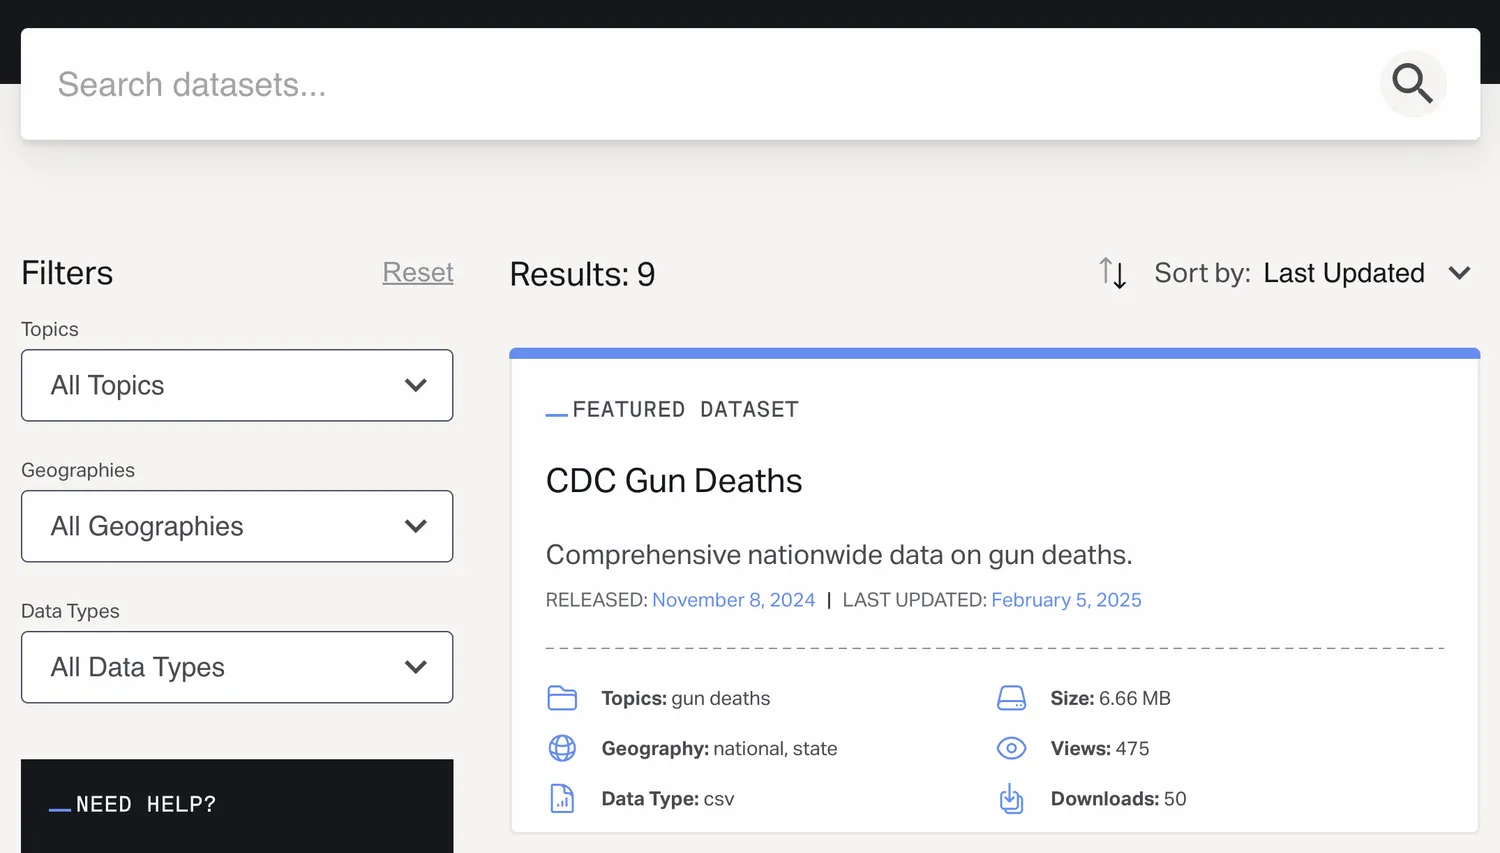
The Trace
Gun Violence Data Hub
PHP
Redivis
Svelte
WordPress
Development
2024
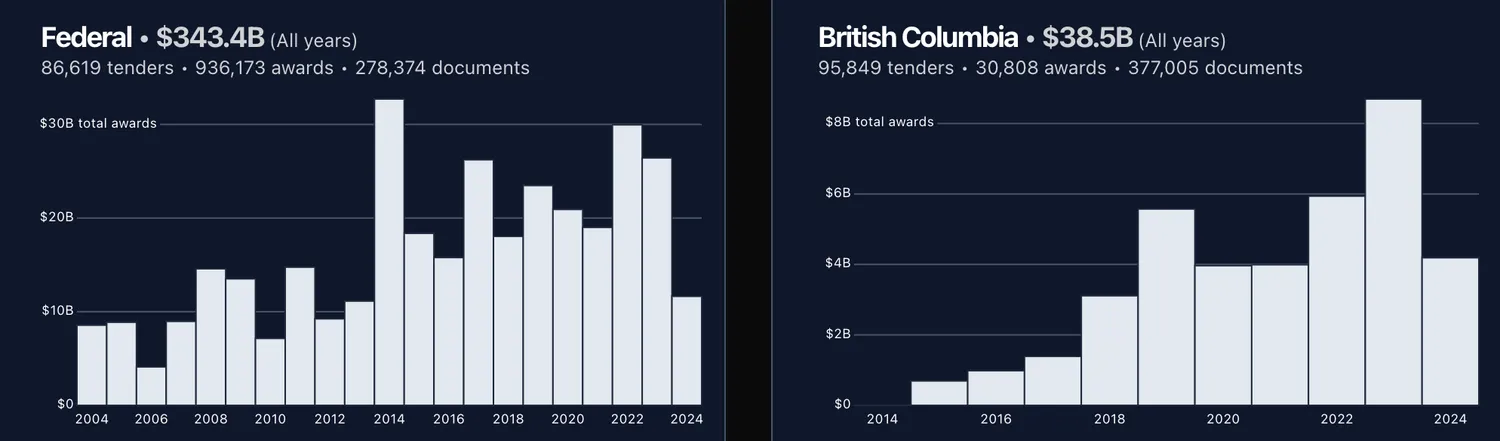
Investigative Journalism Foundation
Procurement
AWS
D3
Next.js
PostgreSQL
Python
React
Data analysis
Dataviz
Design
Development
Project strategy
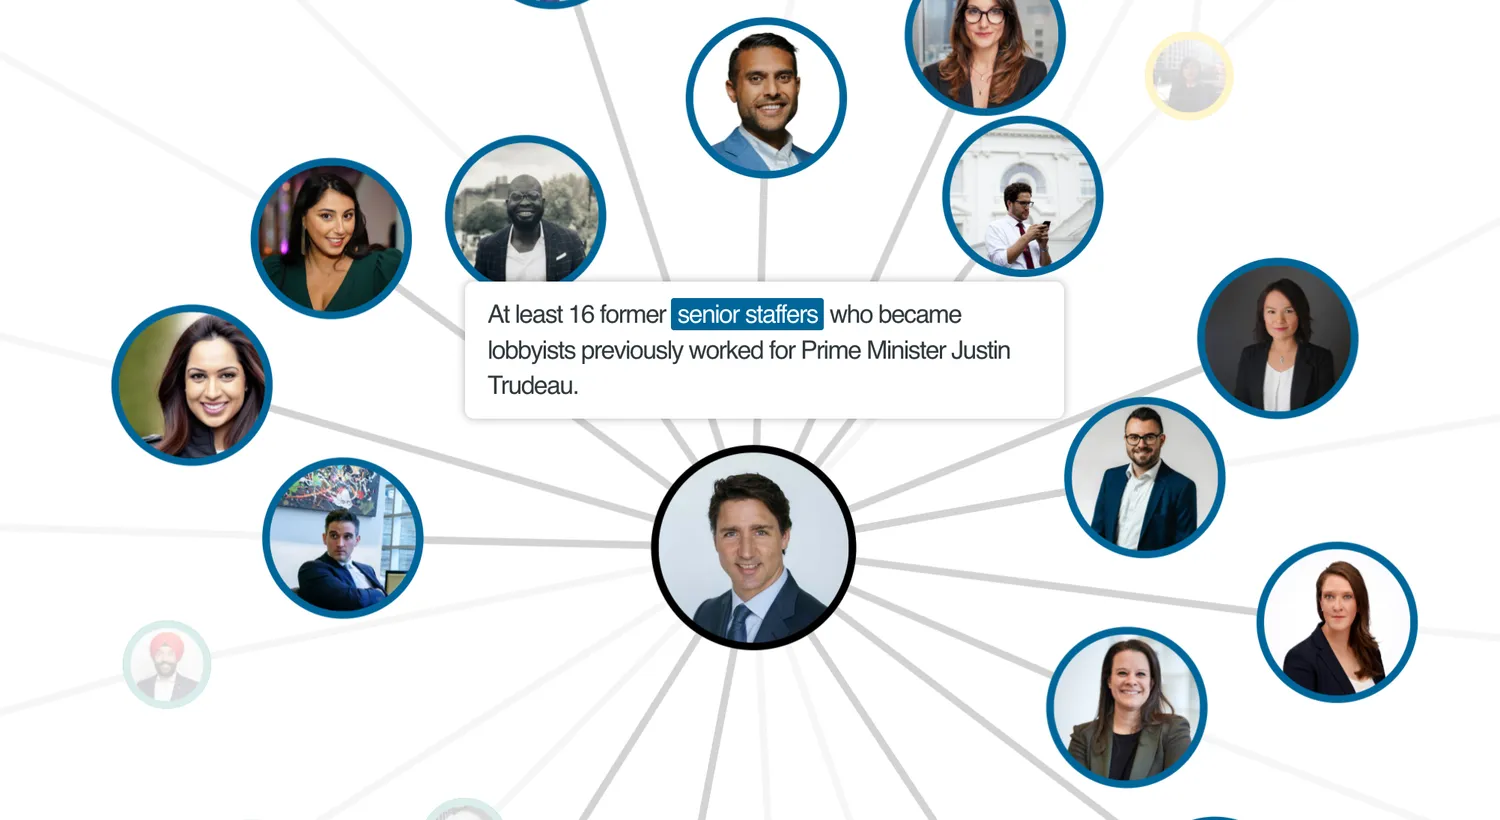
Investigative Journalism Foundation
Meet the lobbyists connected to Canada’s federal party leaders
D3
Svelte
Dataviz
Development
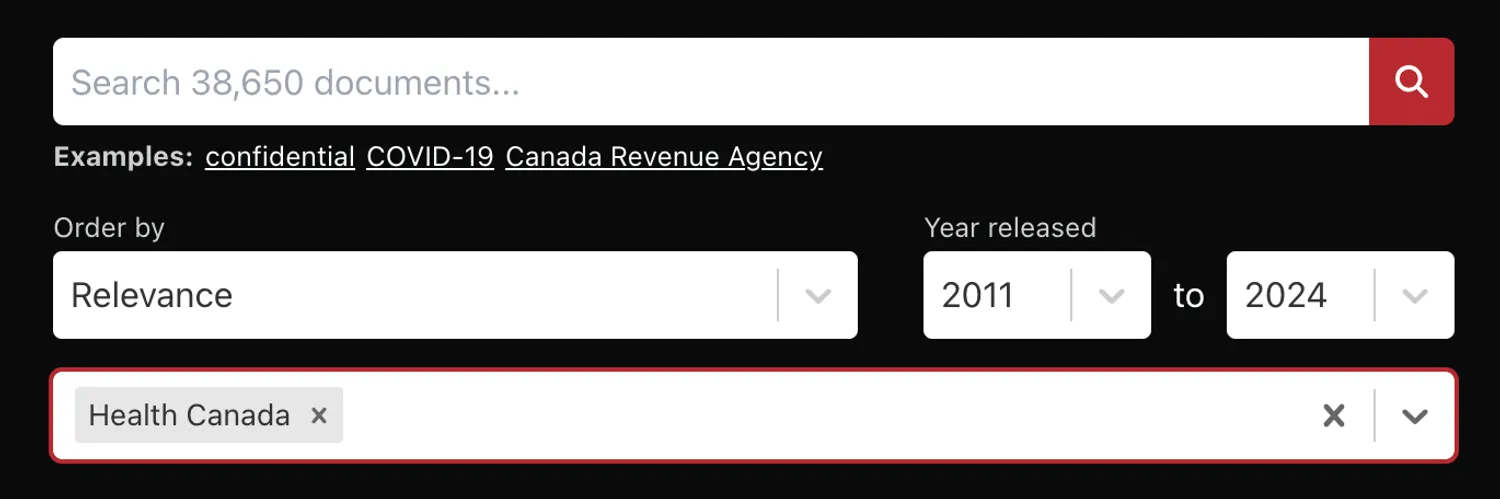
Investigative Journalism Foundation
Open By Default
DocumentCloud
Next.js
React
Design
Development
2023

Global News
Sophi integration
PHP
WordPress
Development
Project strategy
The Examination
Website launch
Project strategy

Global News
How a new ‘nature economy’ is transforming the fight for B.C.’s ancient forests
D3
Svelte
Design
Development
Mapping

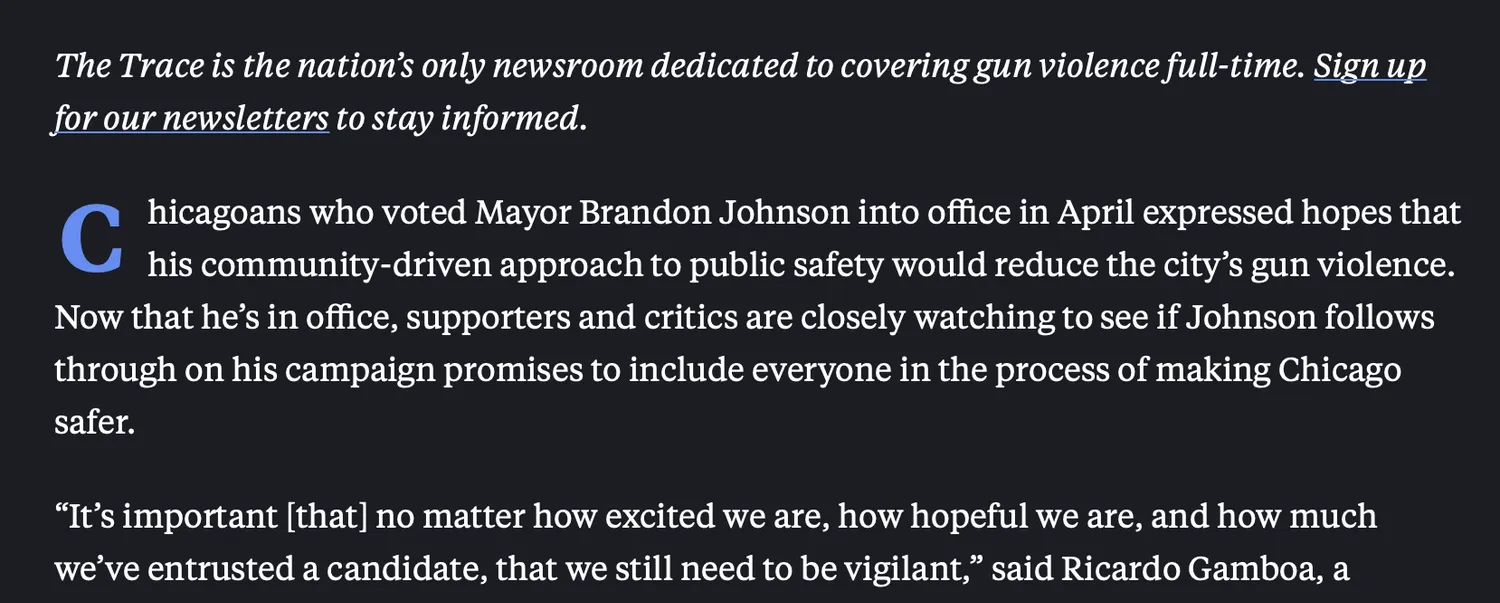
The Trace
Local reporting initiative
PHP
WordPress
Design
Development
Project strategy
2022
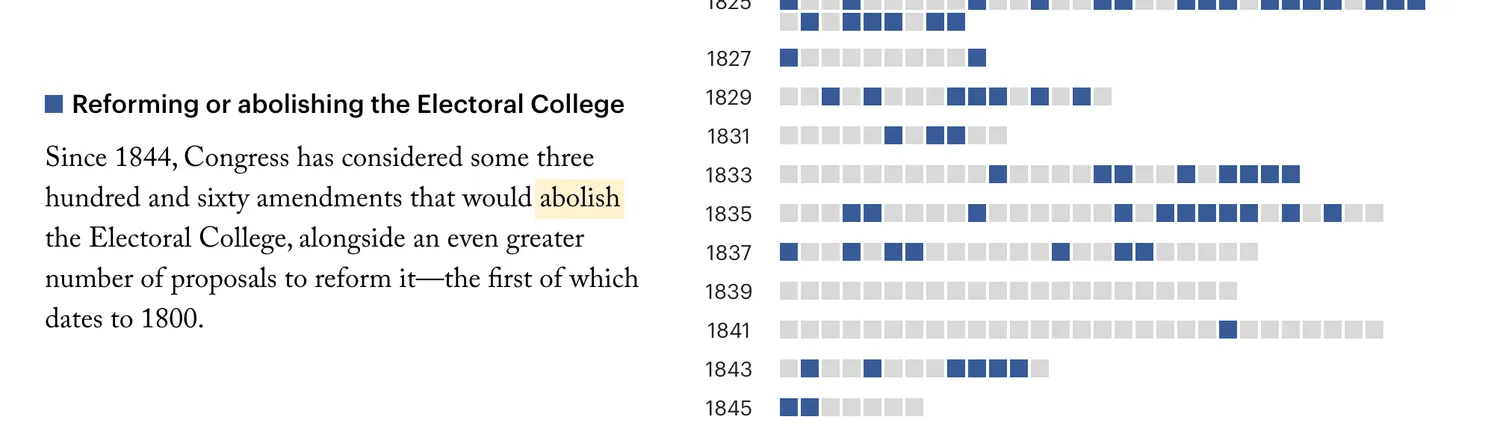
The New Yorker
The United States’ Unamendable Constitution
React
Data analysis
Dataviz
Development
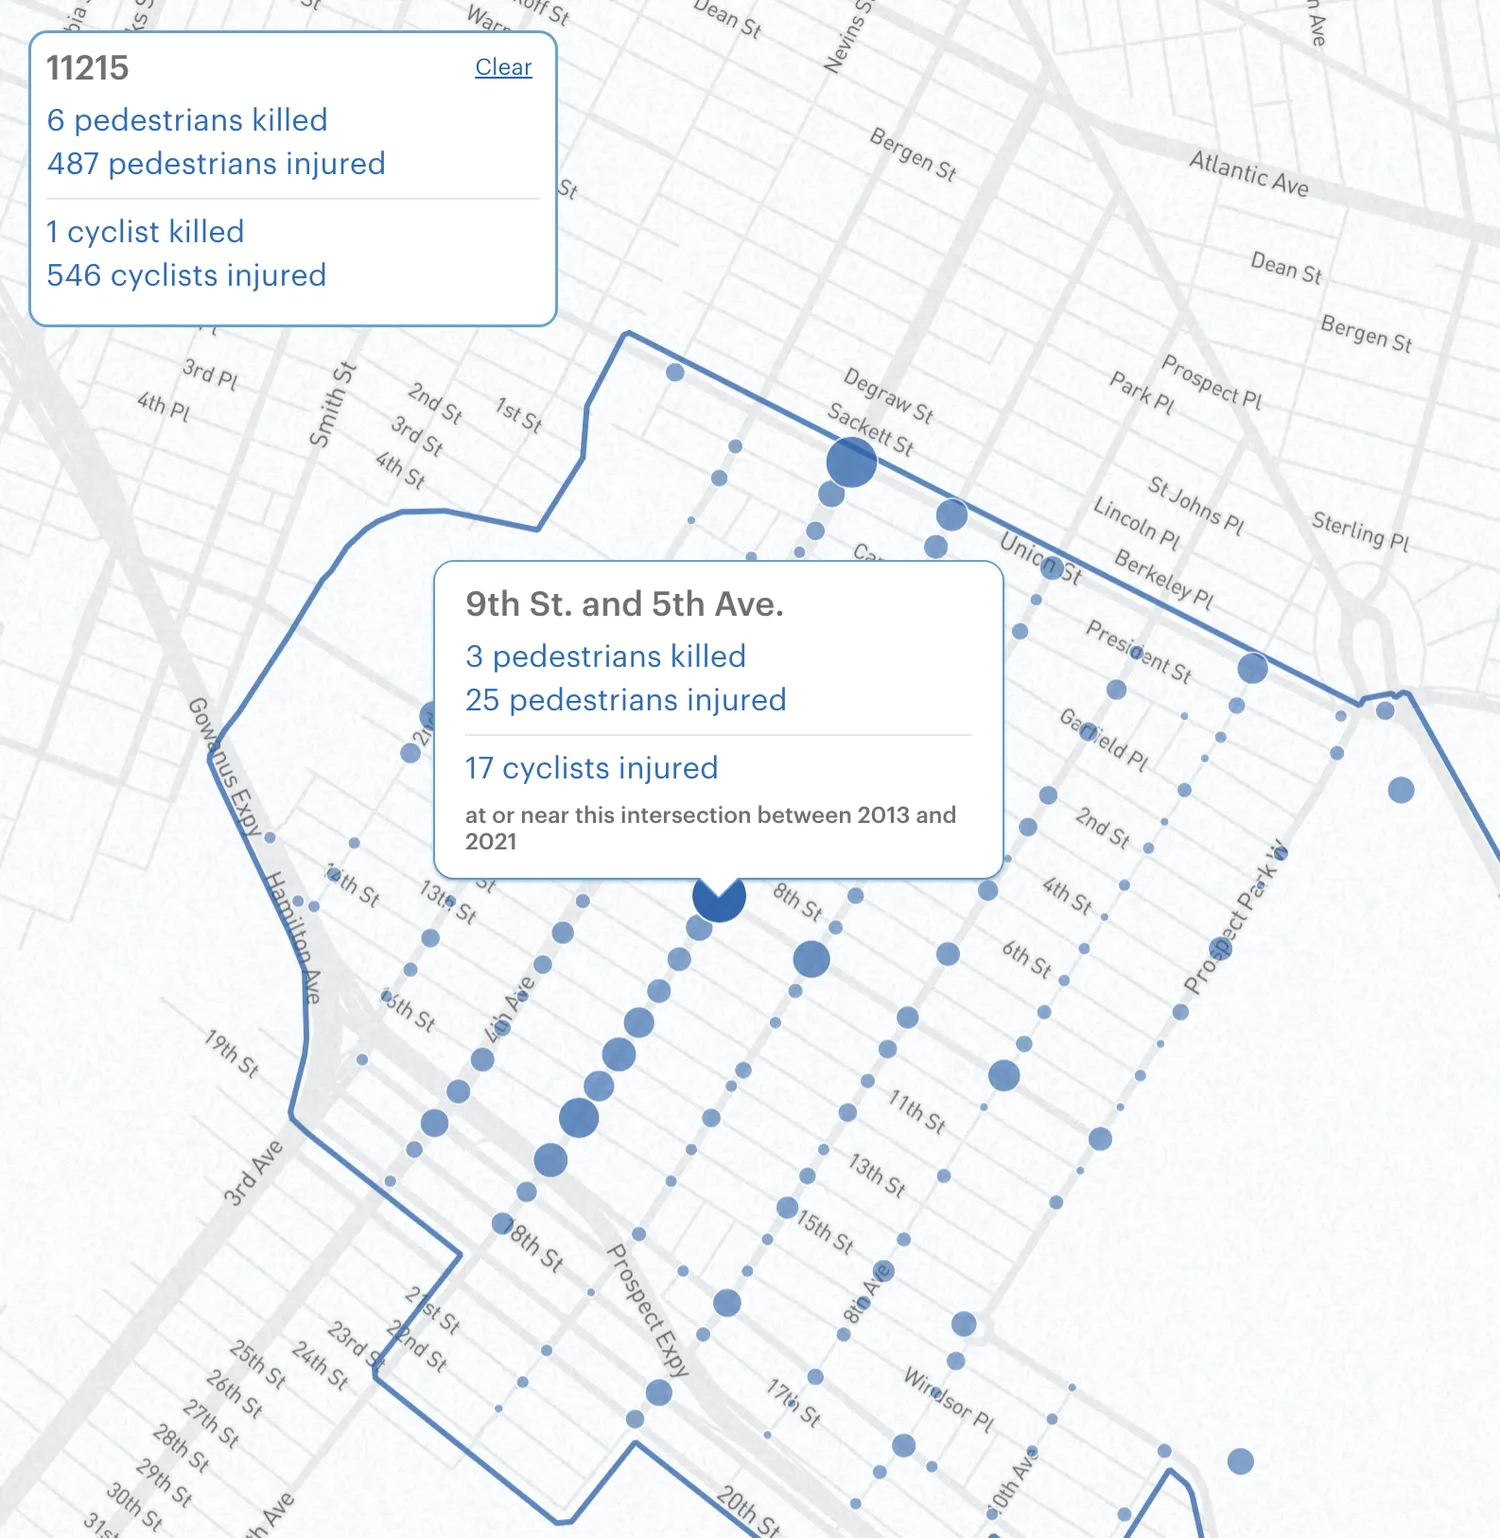
The New Yorker
When Cars Kill
Mapbox
R
React
Data analysis
Development
Mapping
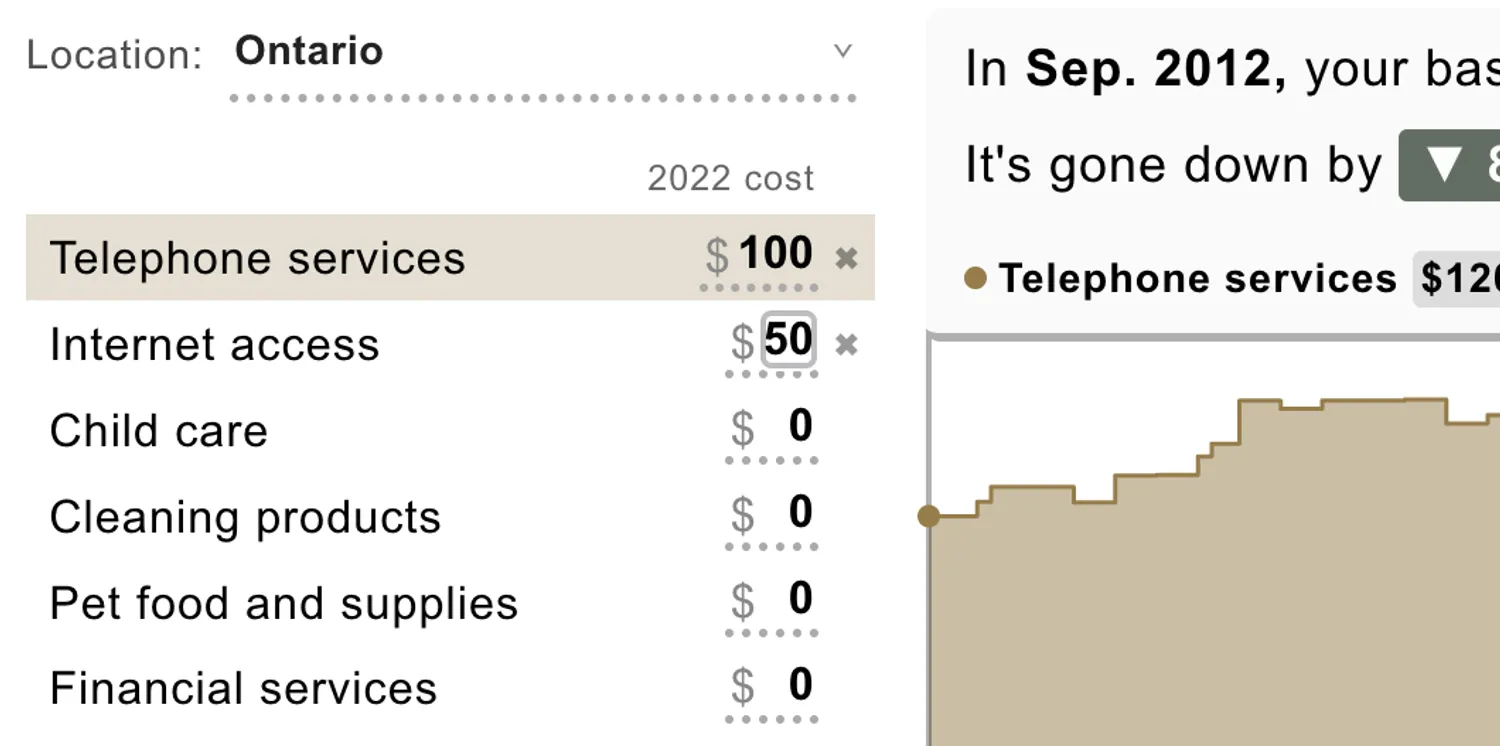
Global News
Inflation calculator: How do rising prices affect your personal finances?
D3
GitHub Actions
R
Svelte
Data analysis
Dataviz
Design
Development
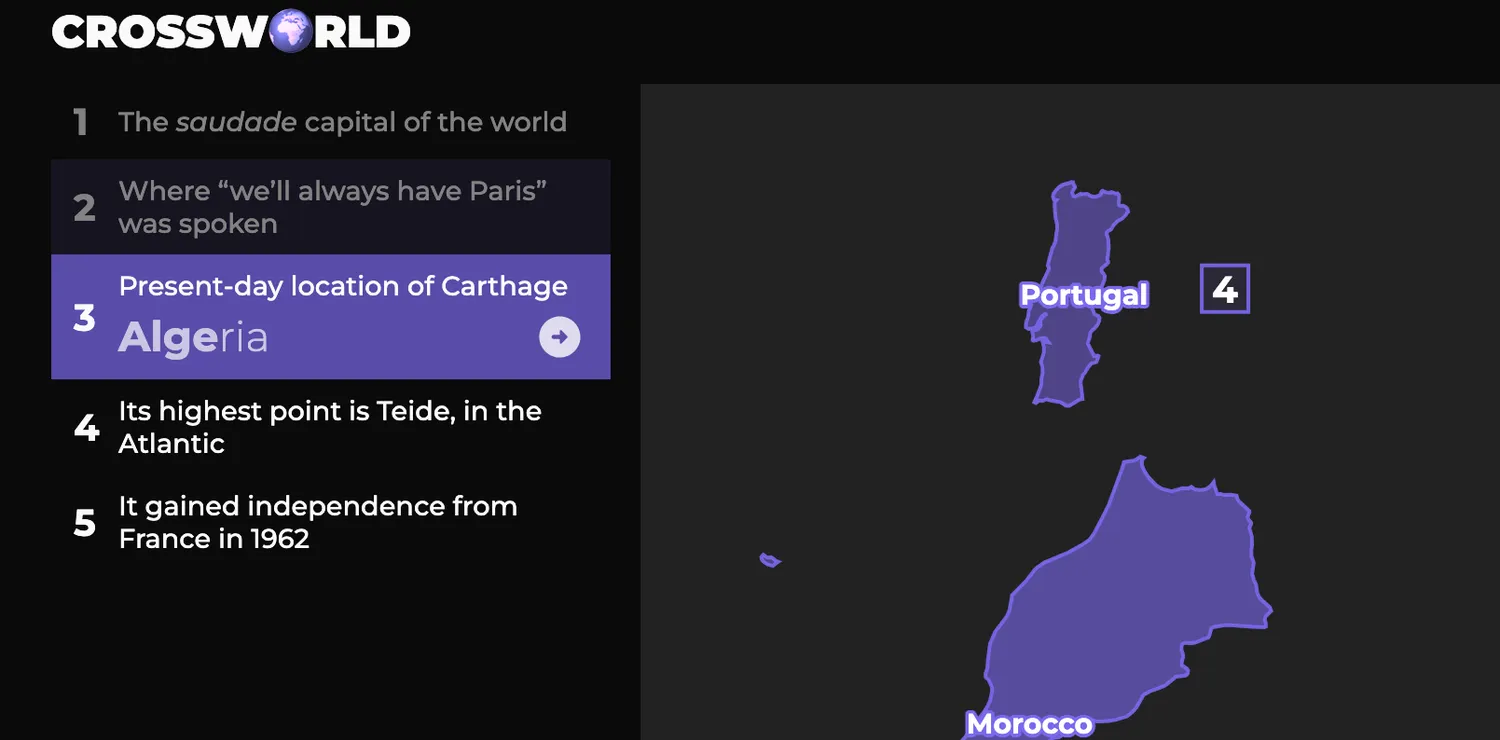
Personal
Crossworld
Svelte
SvelteKit
Design
Development

Global News
Inside COVID’s ‘Invisible Hospitals’
Svelte
Development
Mapping
2021
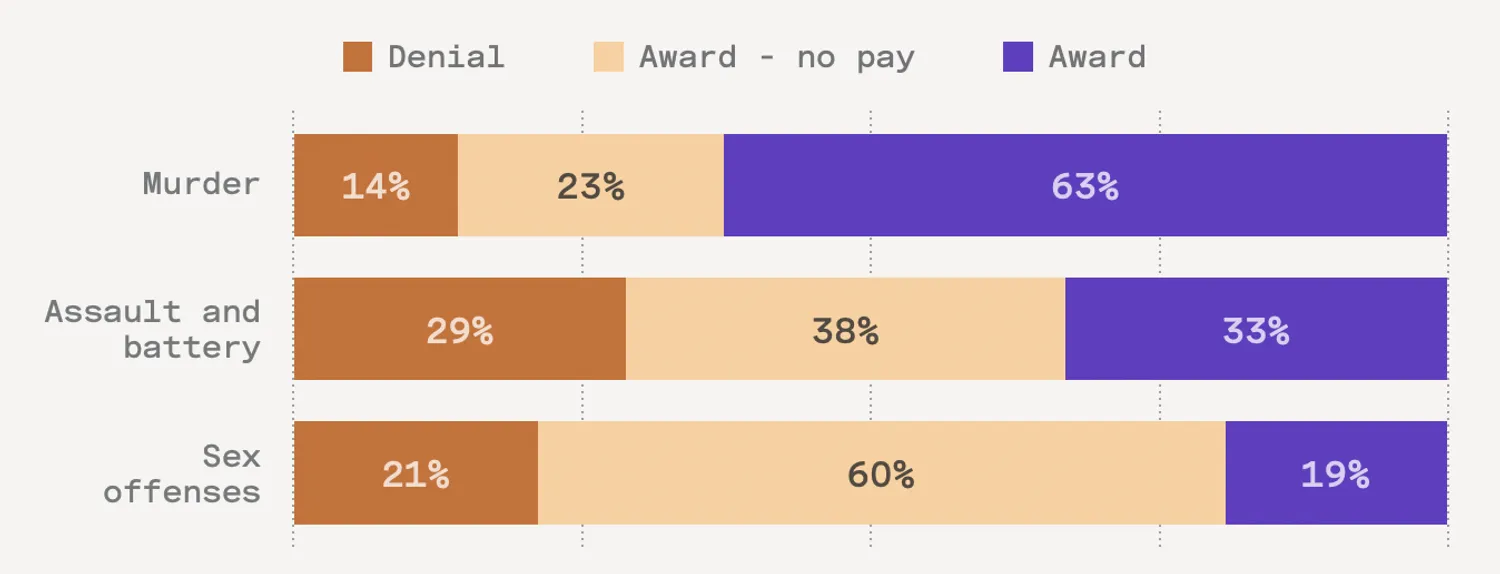
The Trace Chicago Sun-Times Block Club Chicago La Raza
Illinois Has a Program to Compensate Victims of Violent Crimes. Few Applicants Receive Funds.
R
Data analysis
Dataviz
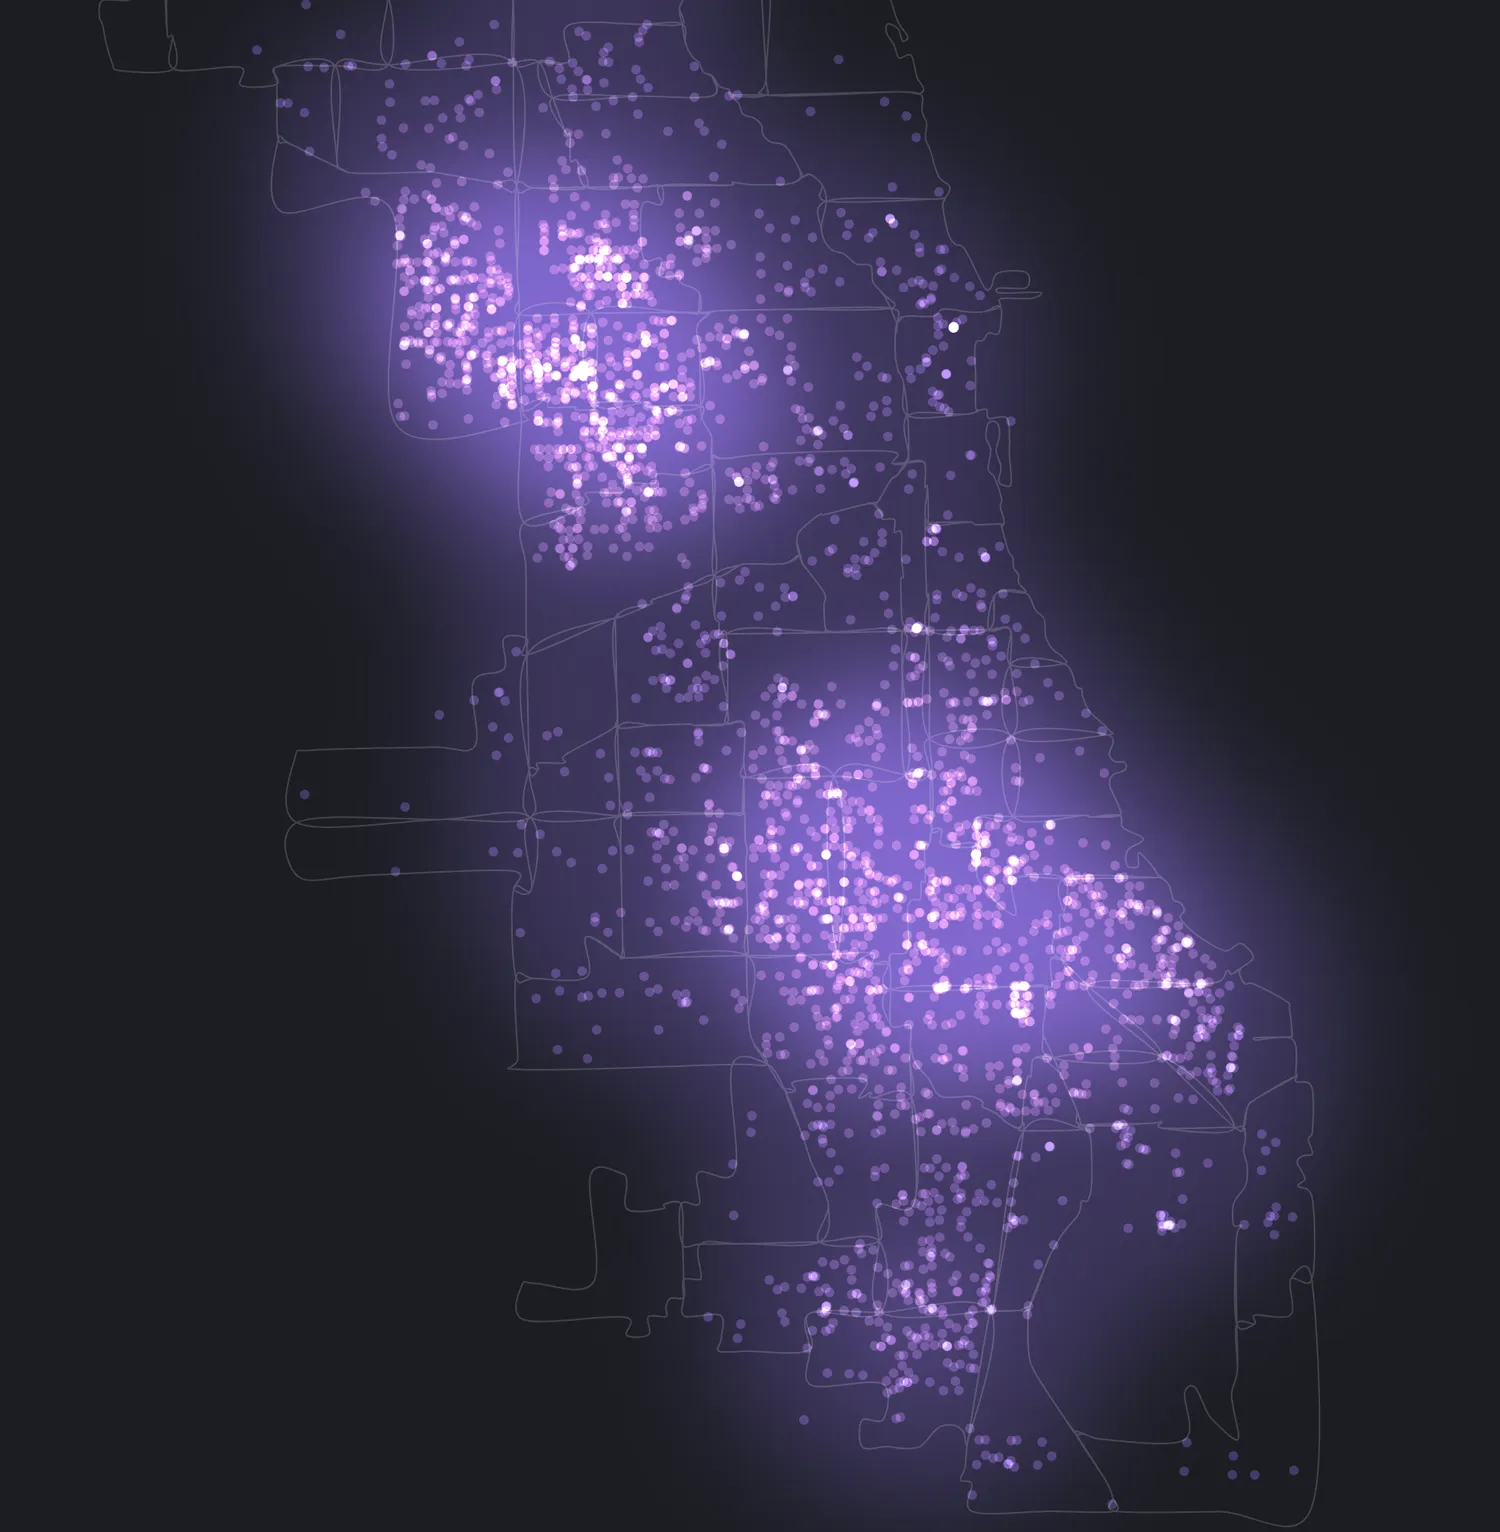
The Trace
“Aftershocks,” a Series About Surviving Gun Violence in Chicago
Canvas
D3
Svelte
Design
Development
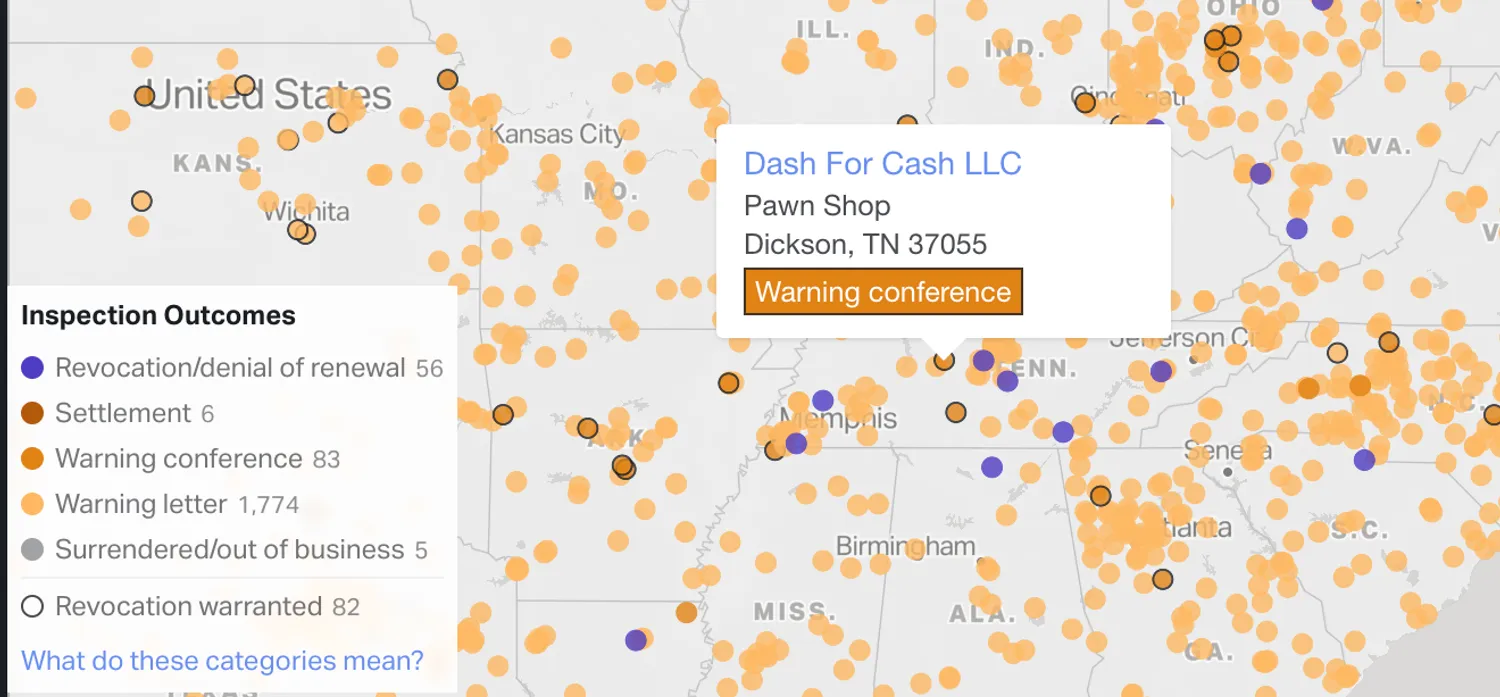
The Trace USA TODAY
Explore Nearly 2,000 Gun Dealer Inspection Reports
Mapbox
Svelte
SvelteKit
Data analysis
Design
Development
Mapping
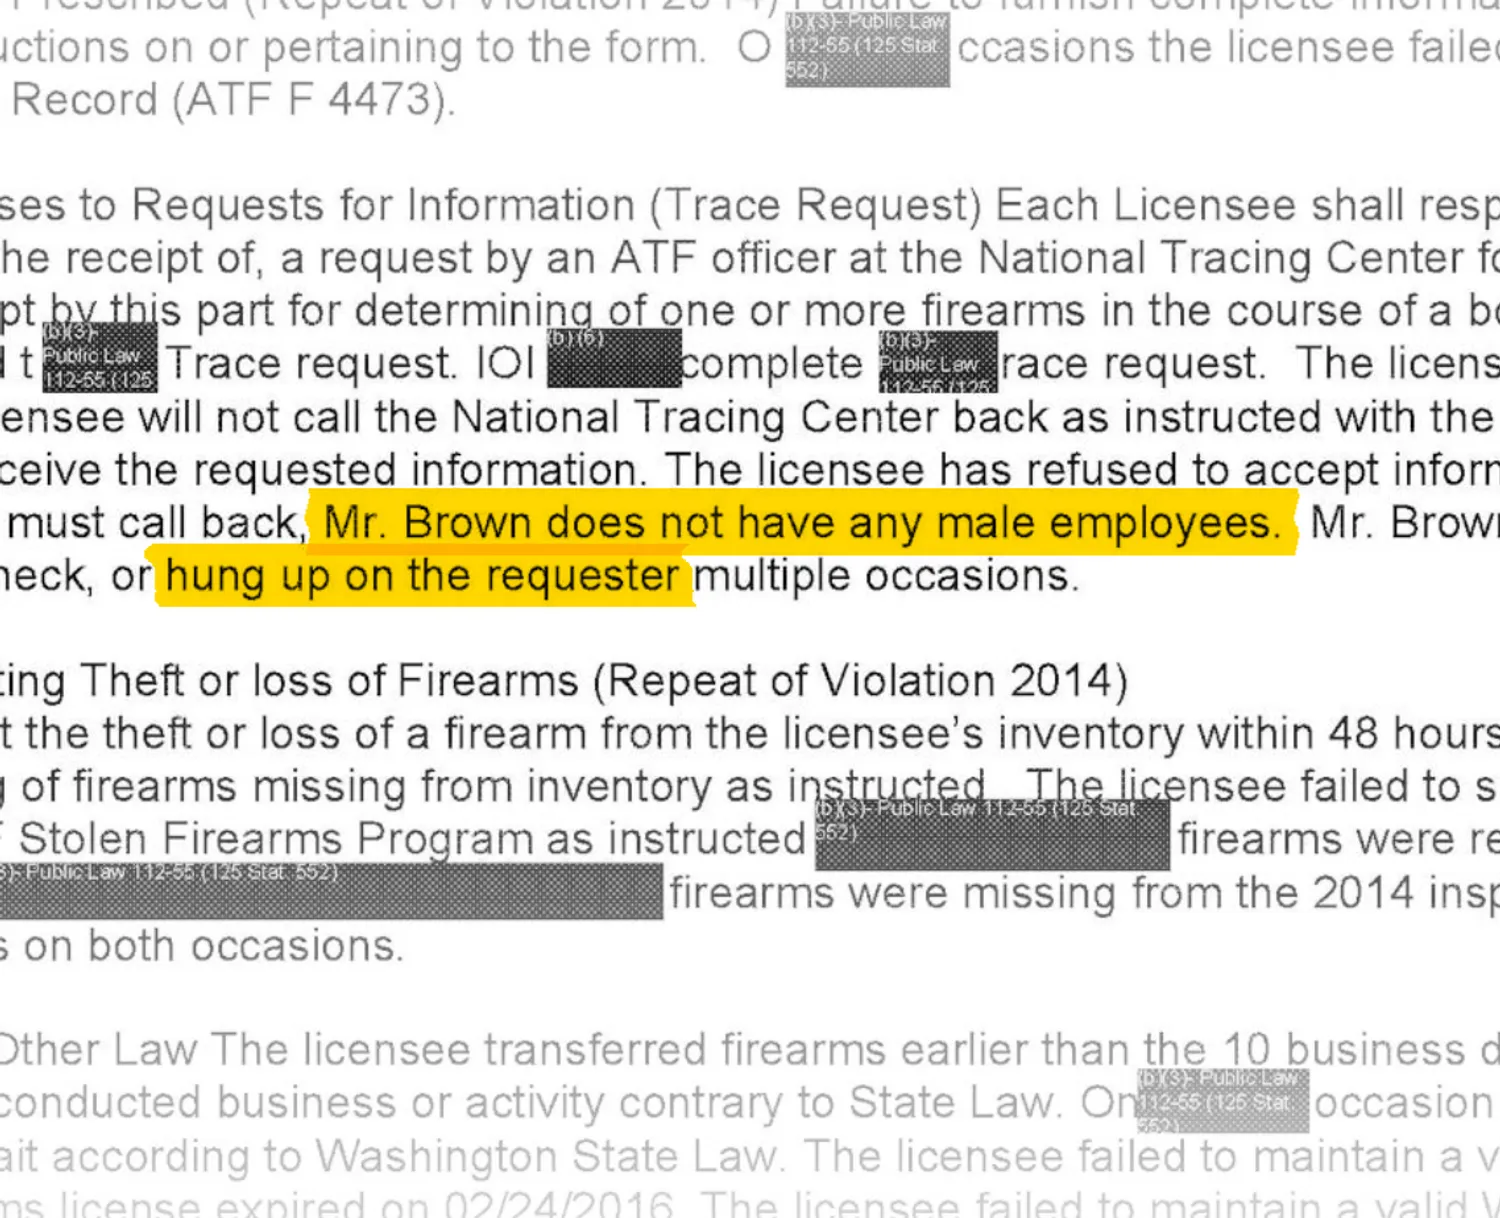
The Trace USA TODAY
The ATF Catches Thousands of Lawbreaking Gun Dealers Every Year. It Shuts Down Very Few.
Svelte
Dataviz
Design
Development
2020
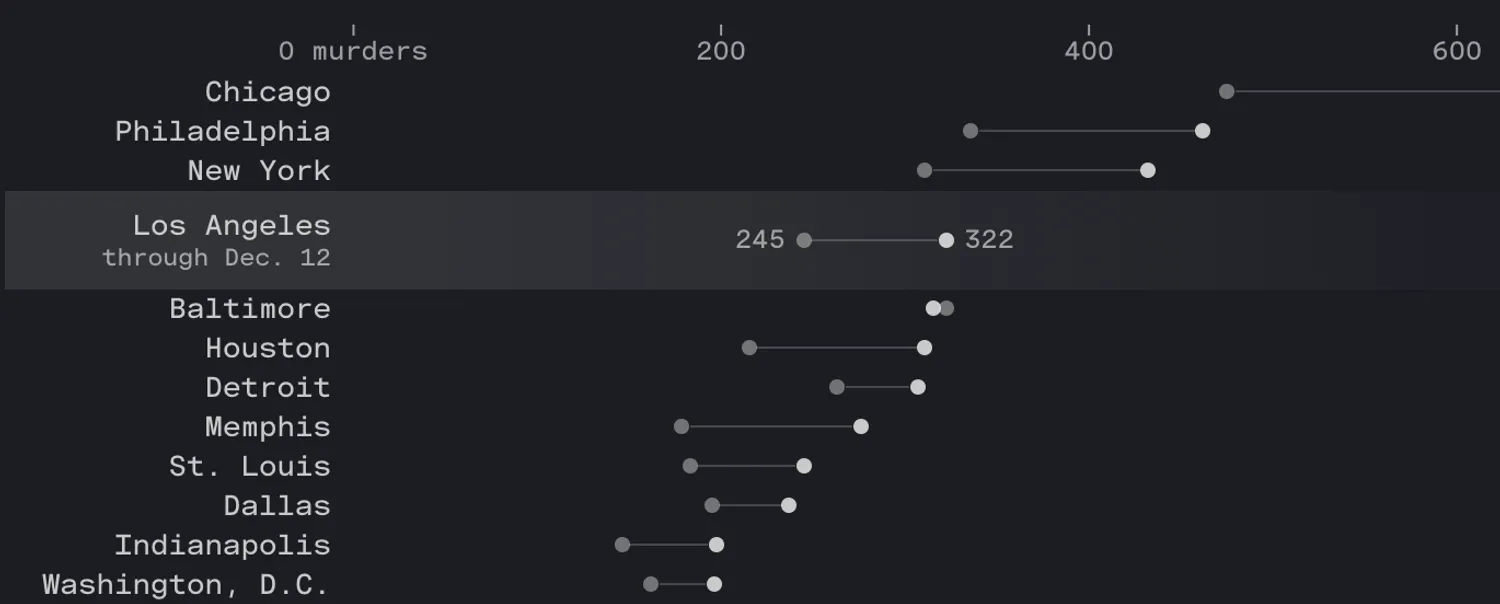
The Trace
A Historic Surge in Gun Violence Compounds the Traumas of 2020
D3
Svelte
Data analysis
Dataviz
Design
Development
The Trace
Apple News integration
AWS
Apple News
Node.js
WordPress
Development
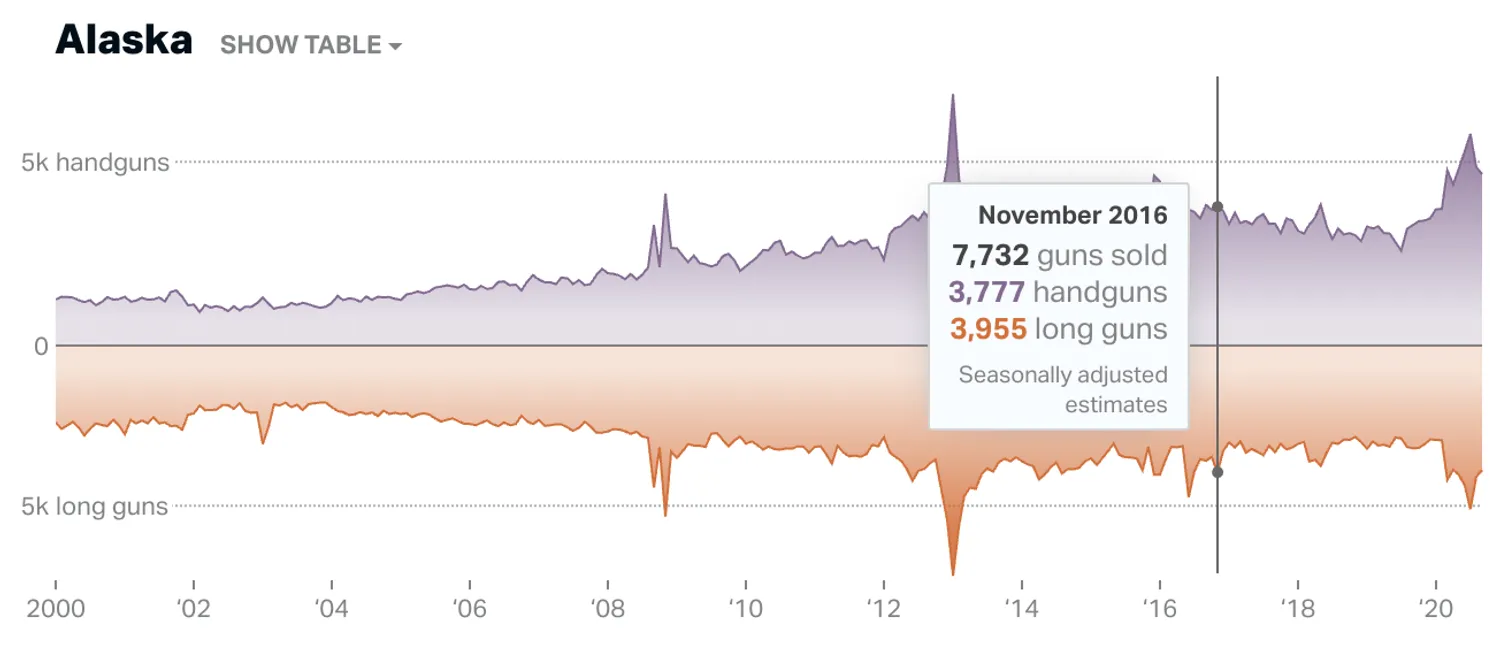
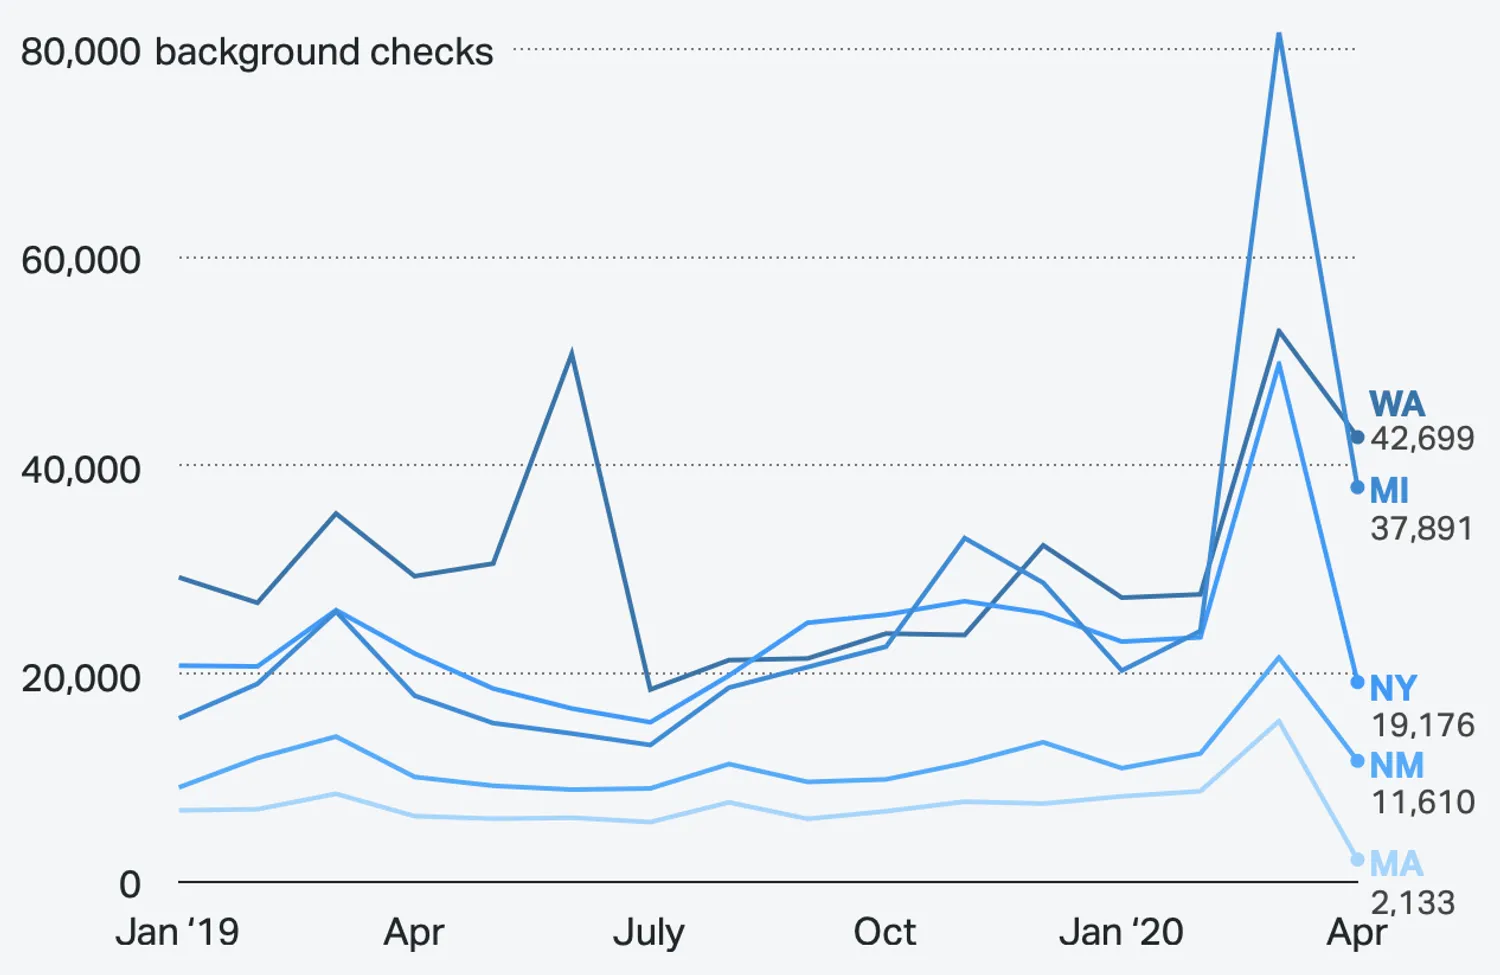
The Trace
How Many Guns Did Americans Buy Last Month?
Python
Svelte
Data analysis
Dataviz
Design
Development
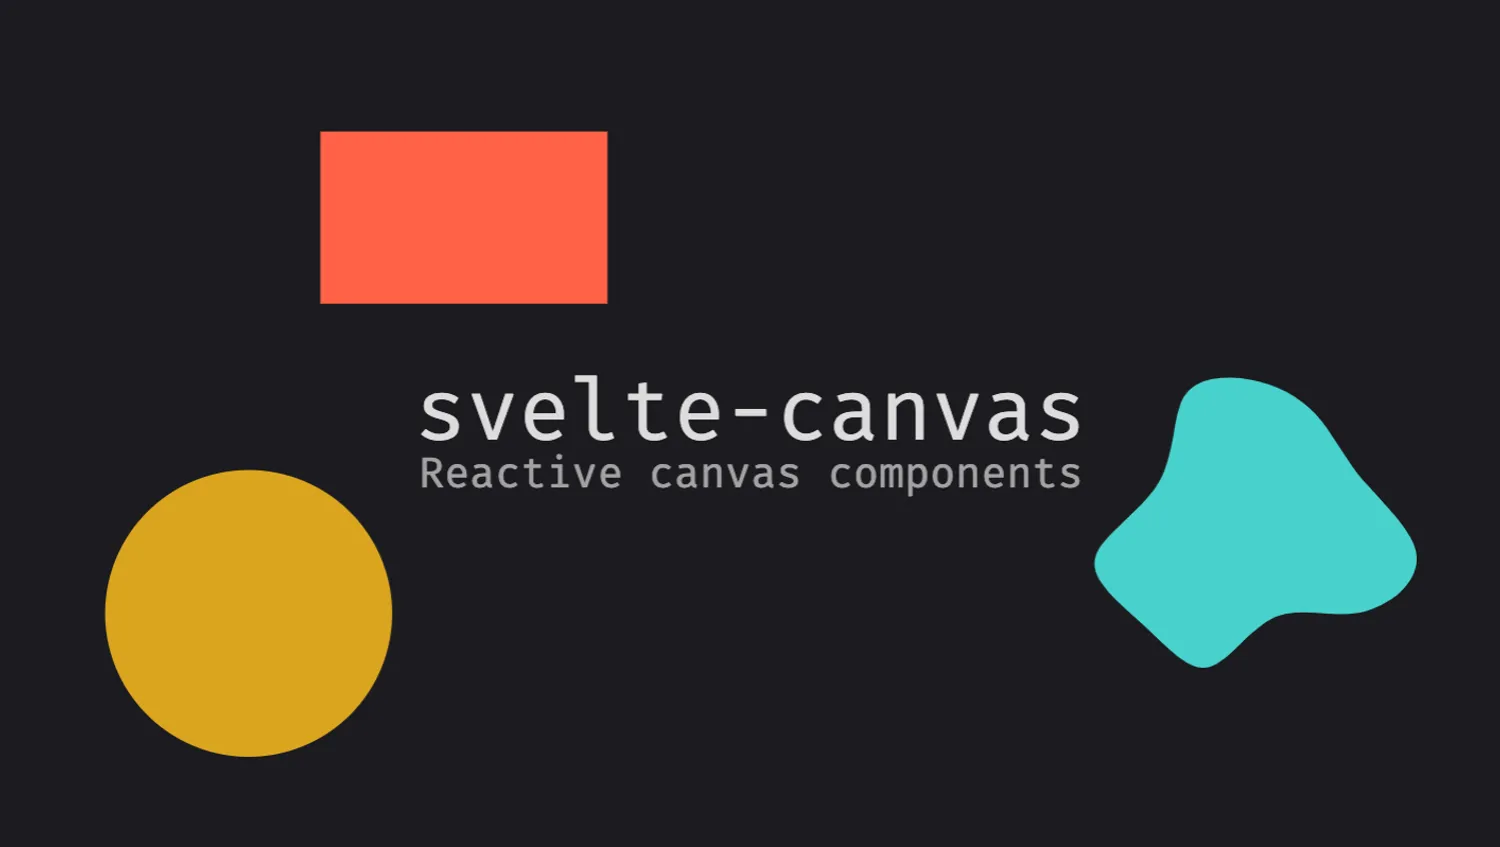
Personal
svelte-canvas
Canvas
Svelte
Development
The Trace USA TODAY
Gun Shops Flouted State Closure Orders in April as Industry Notched Another Big Month
D3
R
Data analysis
Dataviz
2019

The Trace
Since Parkland
Project strategy
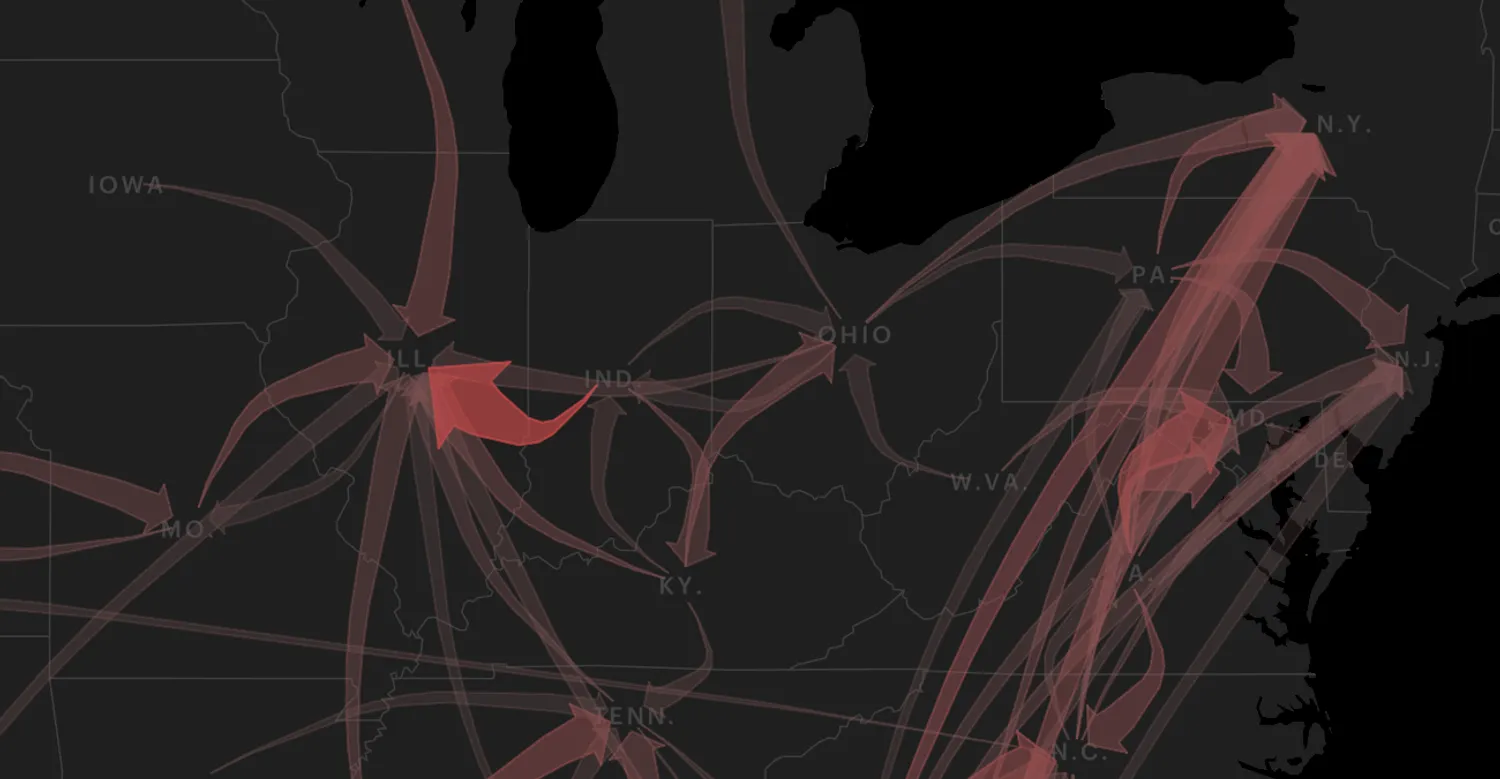
The Trace The New Yorker
Easy Targets
Mapbox
React
Data analysis
Dataviz
Development
Mapping
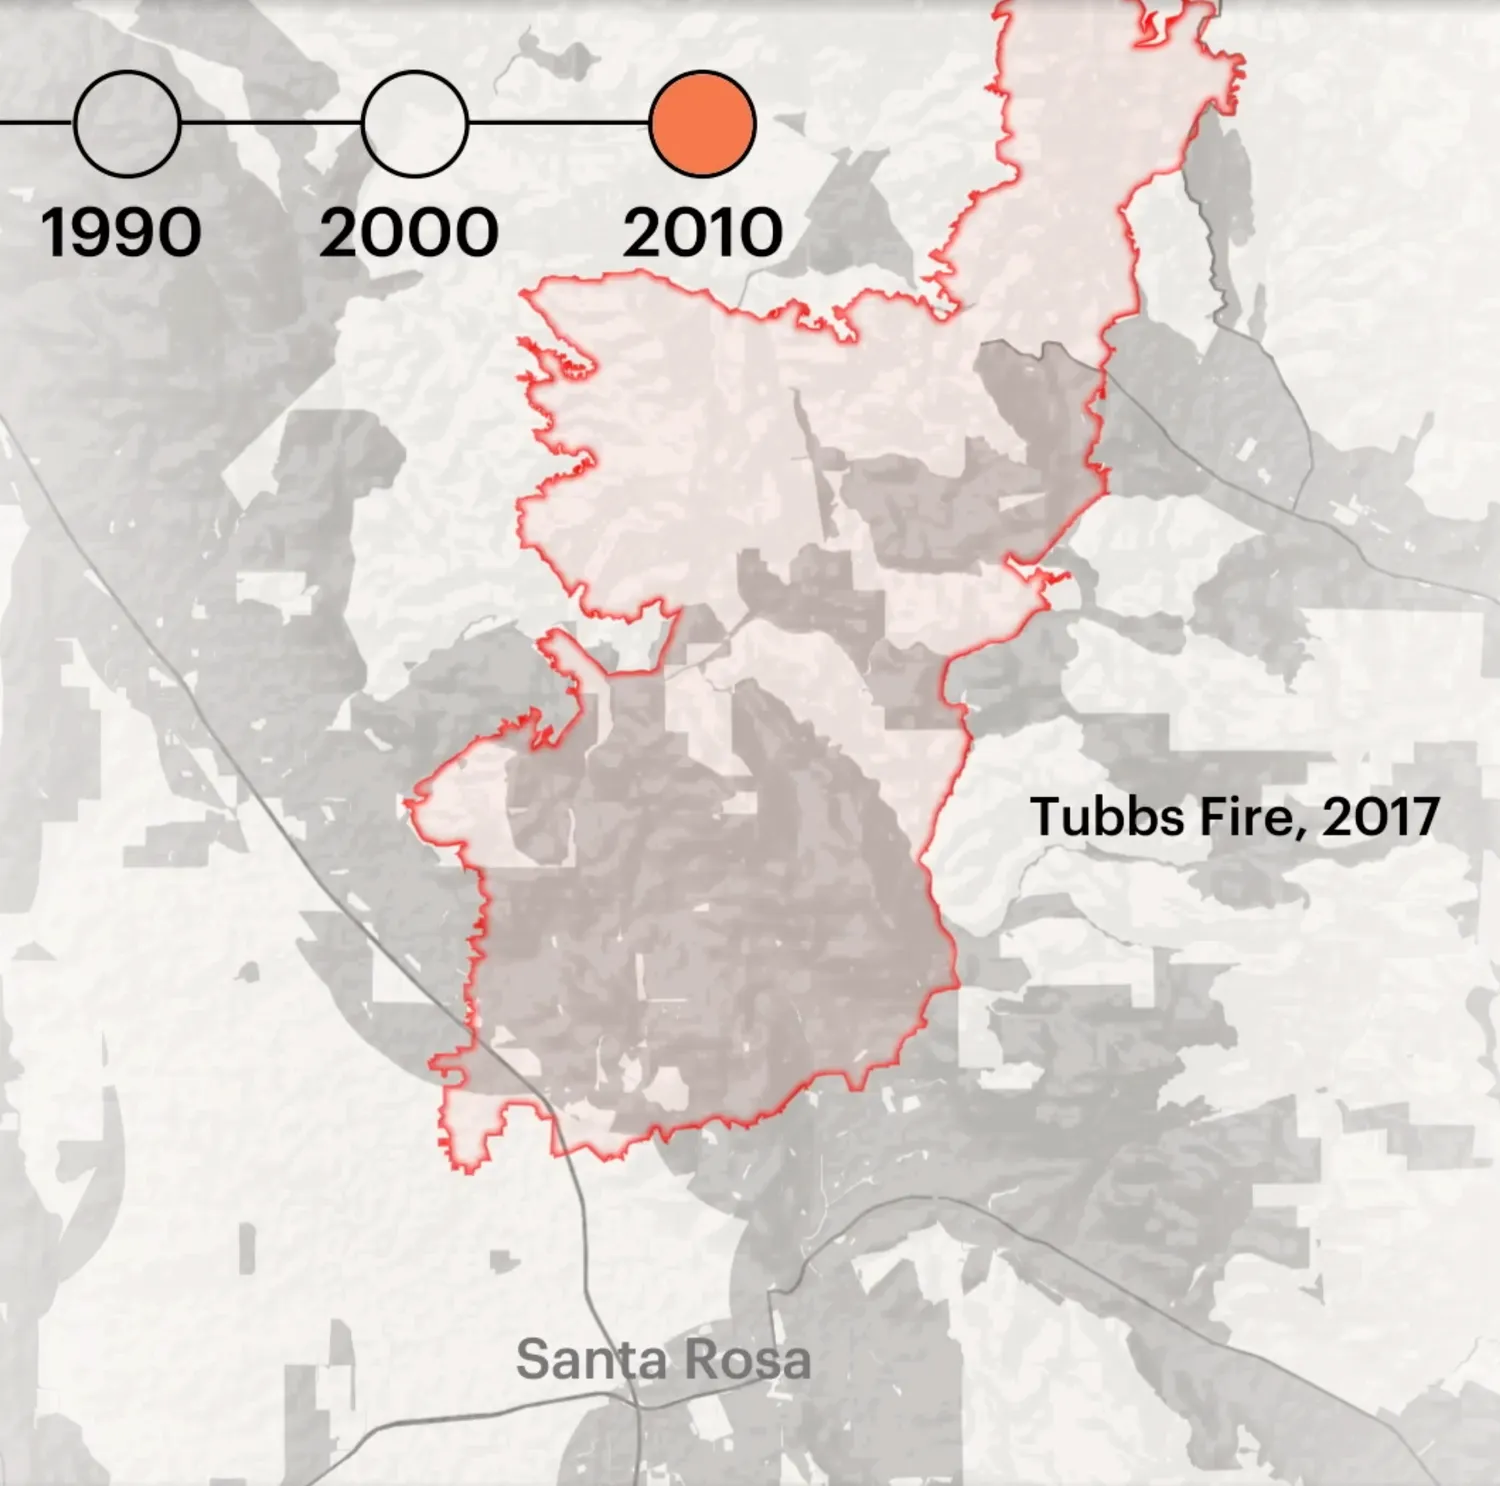
The New Yorker
Fireproofing the Future in California
D3
R
Data analysis
Mapping
2018
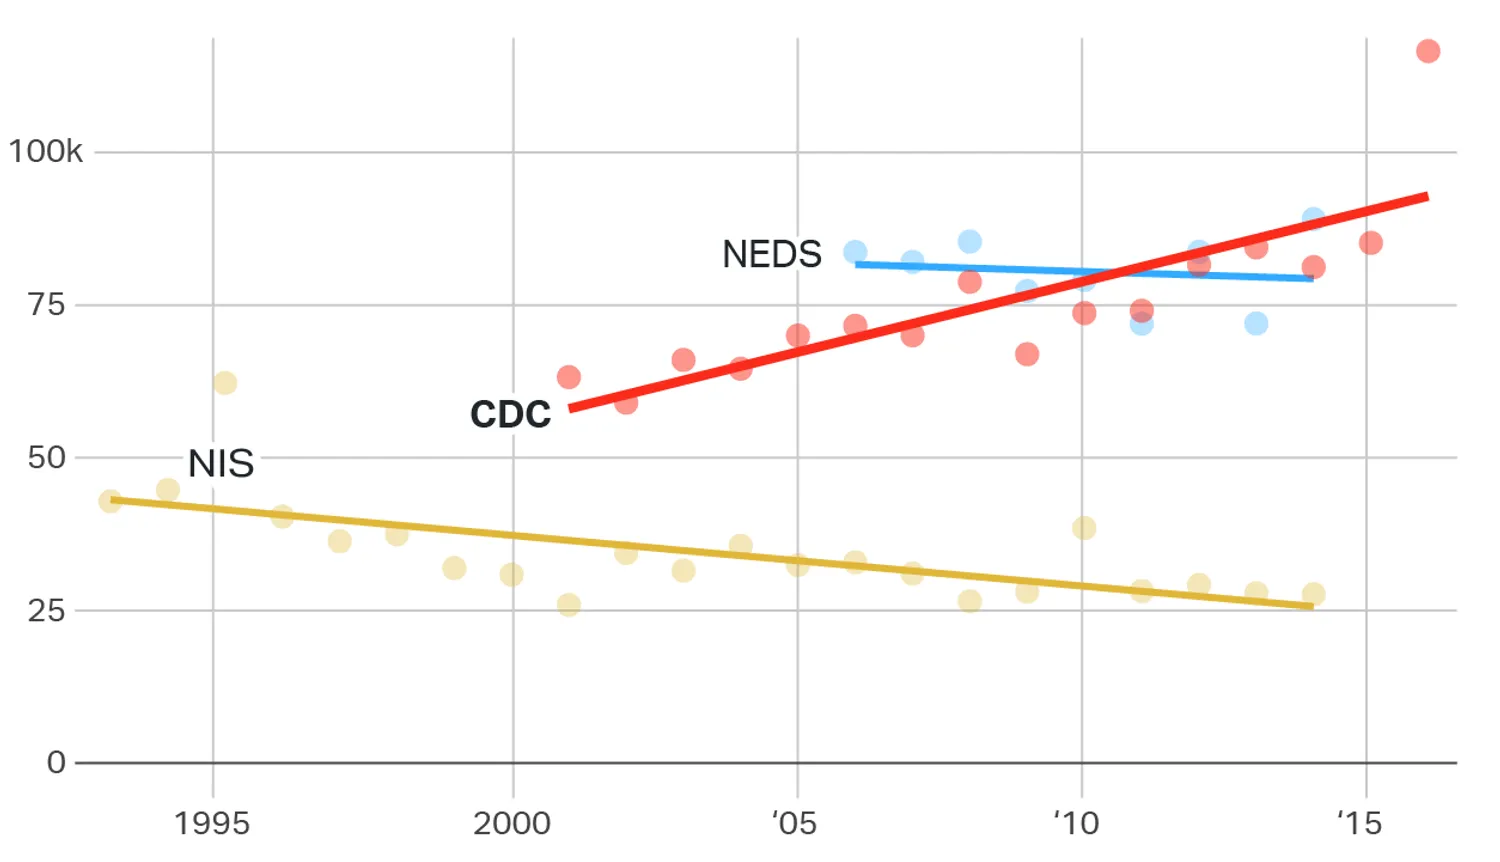
The Trace FiveThirtyEight
The CDC Says Gun Injuries Are on the Rise. But There Are Big Problems With Its Data.
R
Data analysis
The Trace
Follow the NRA’s Spending on the 2018 Midterms, Down to the Last Dollar
AWS
D3
Svelte
Data analysis
Design
Development
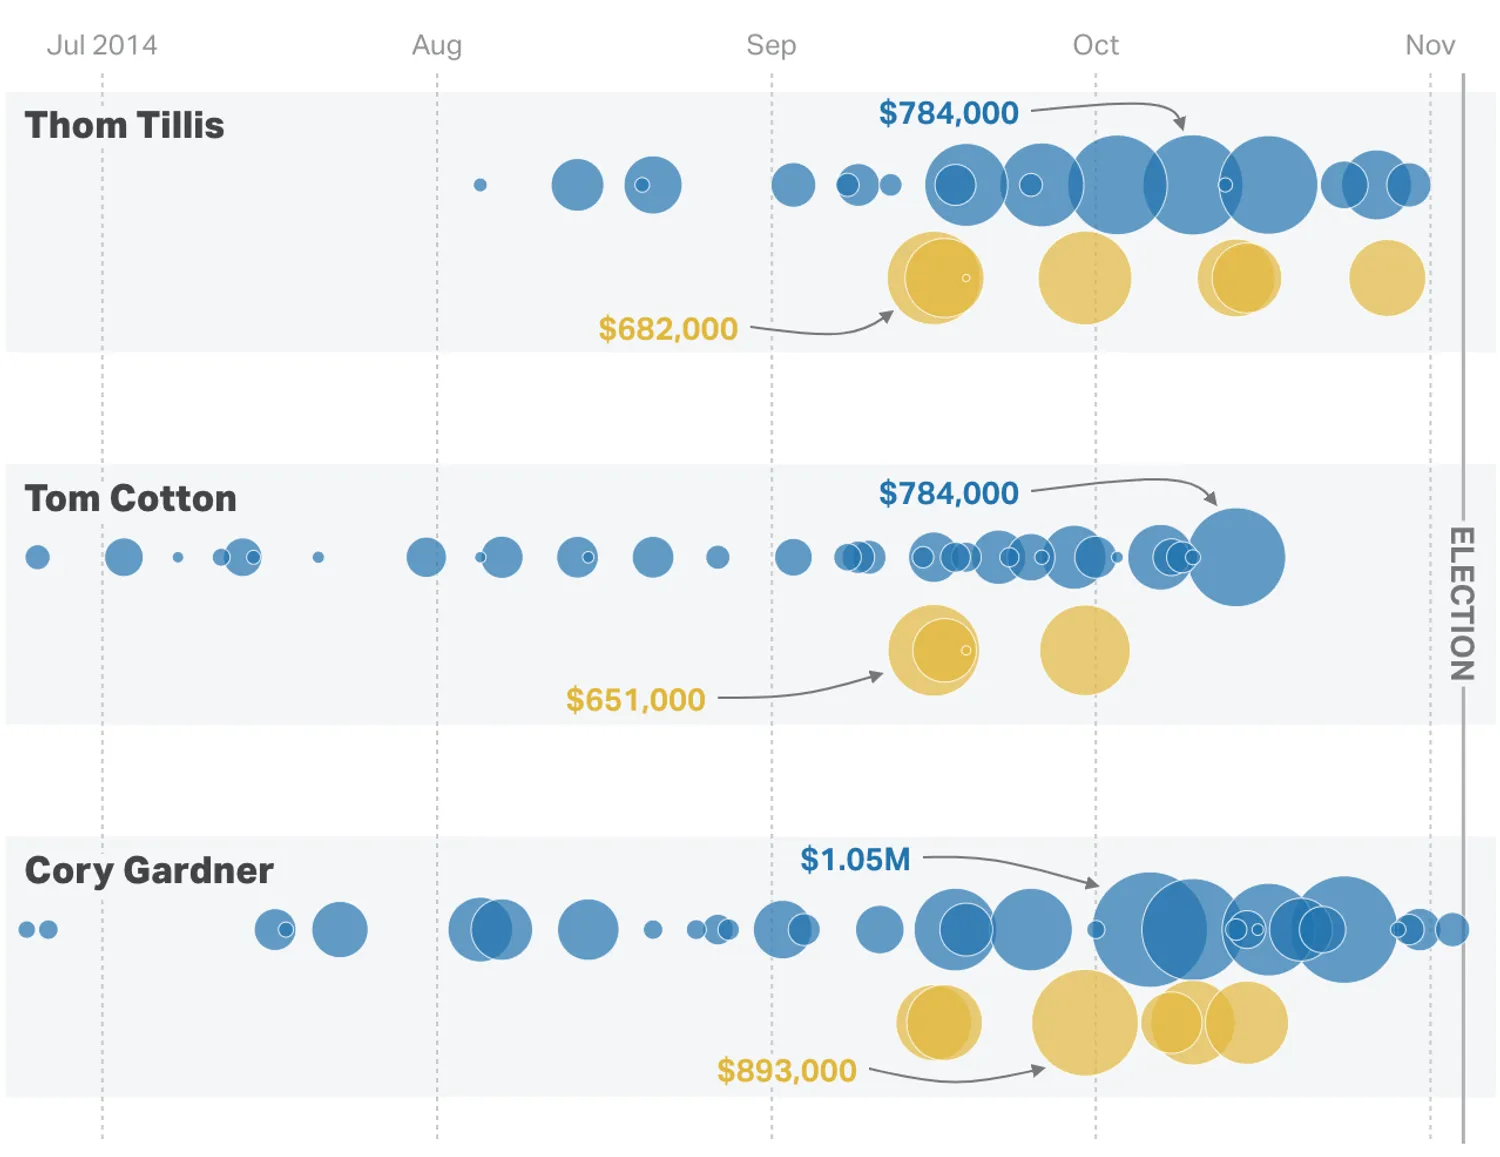
The Trace Politico
The Mystery Firm That Has Become the NRA’s Top Election Consultant
D3
Data analysis
Dataviz
Design
Development
2017
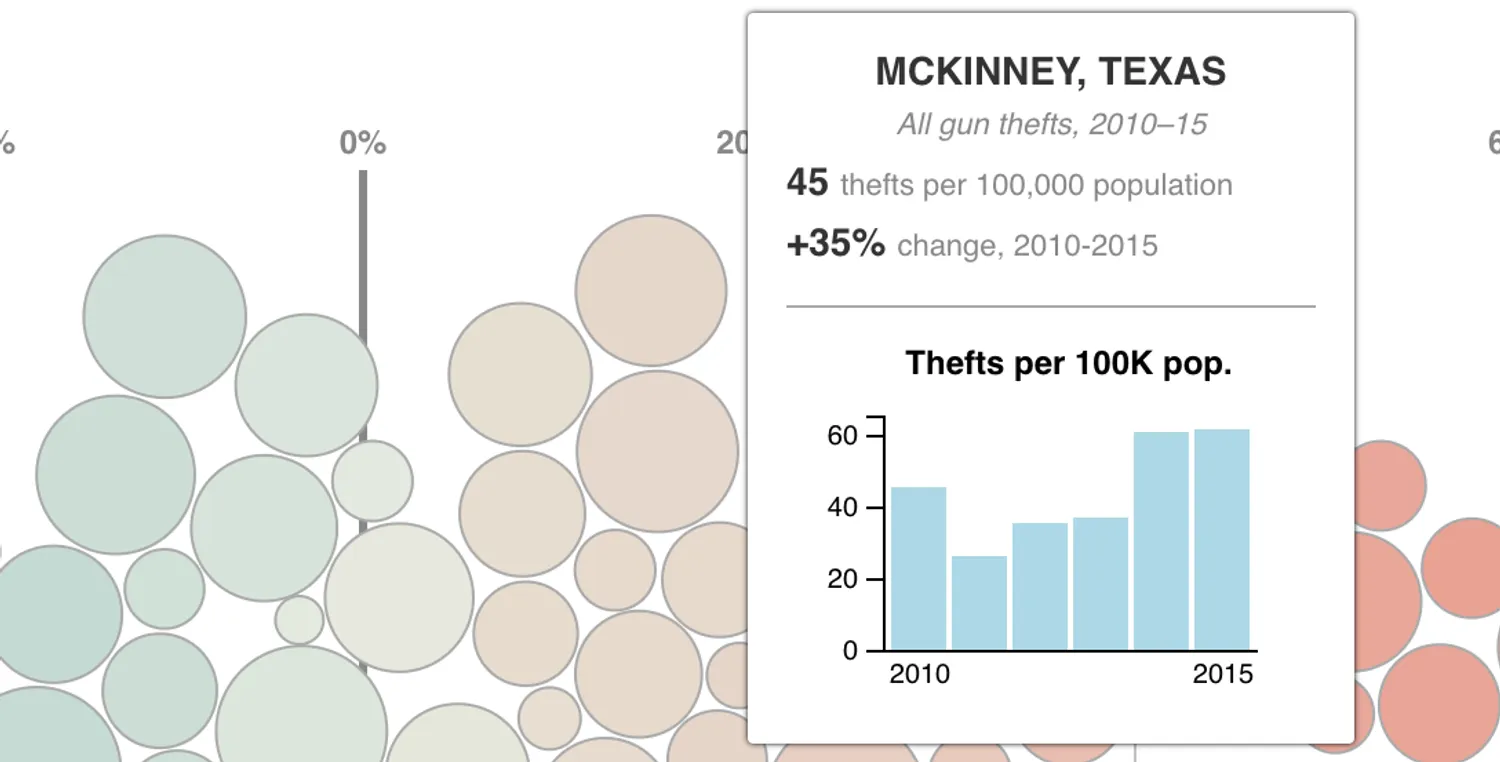
The Trace NBC
Missing Pieces
D3
OpenRefine
Data analysis
Dataviz
Design
Development
2016
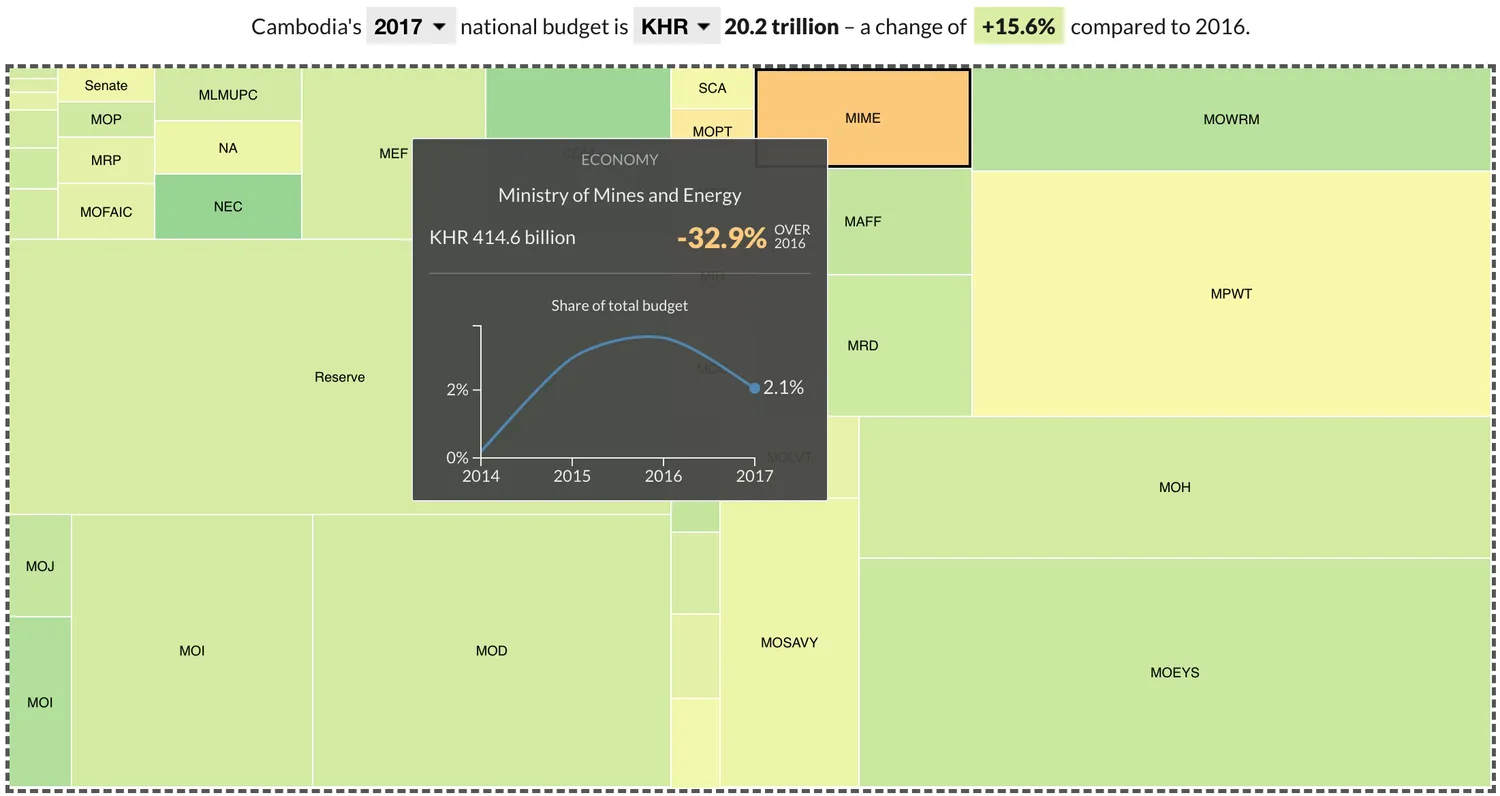
The Phnom Penh Post
Visualising Cambodia’s national budget
D3
Data analysis
Dataviz
Design
Development
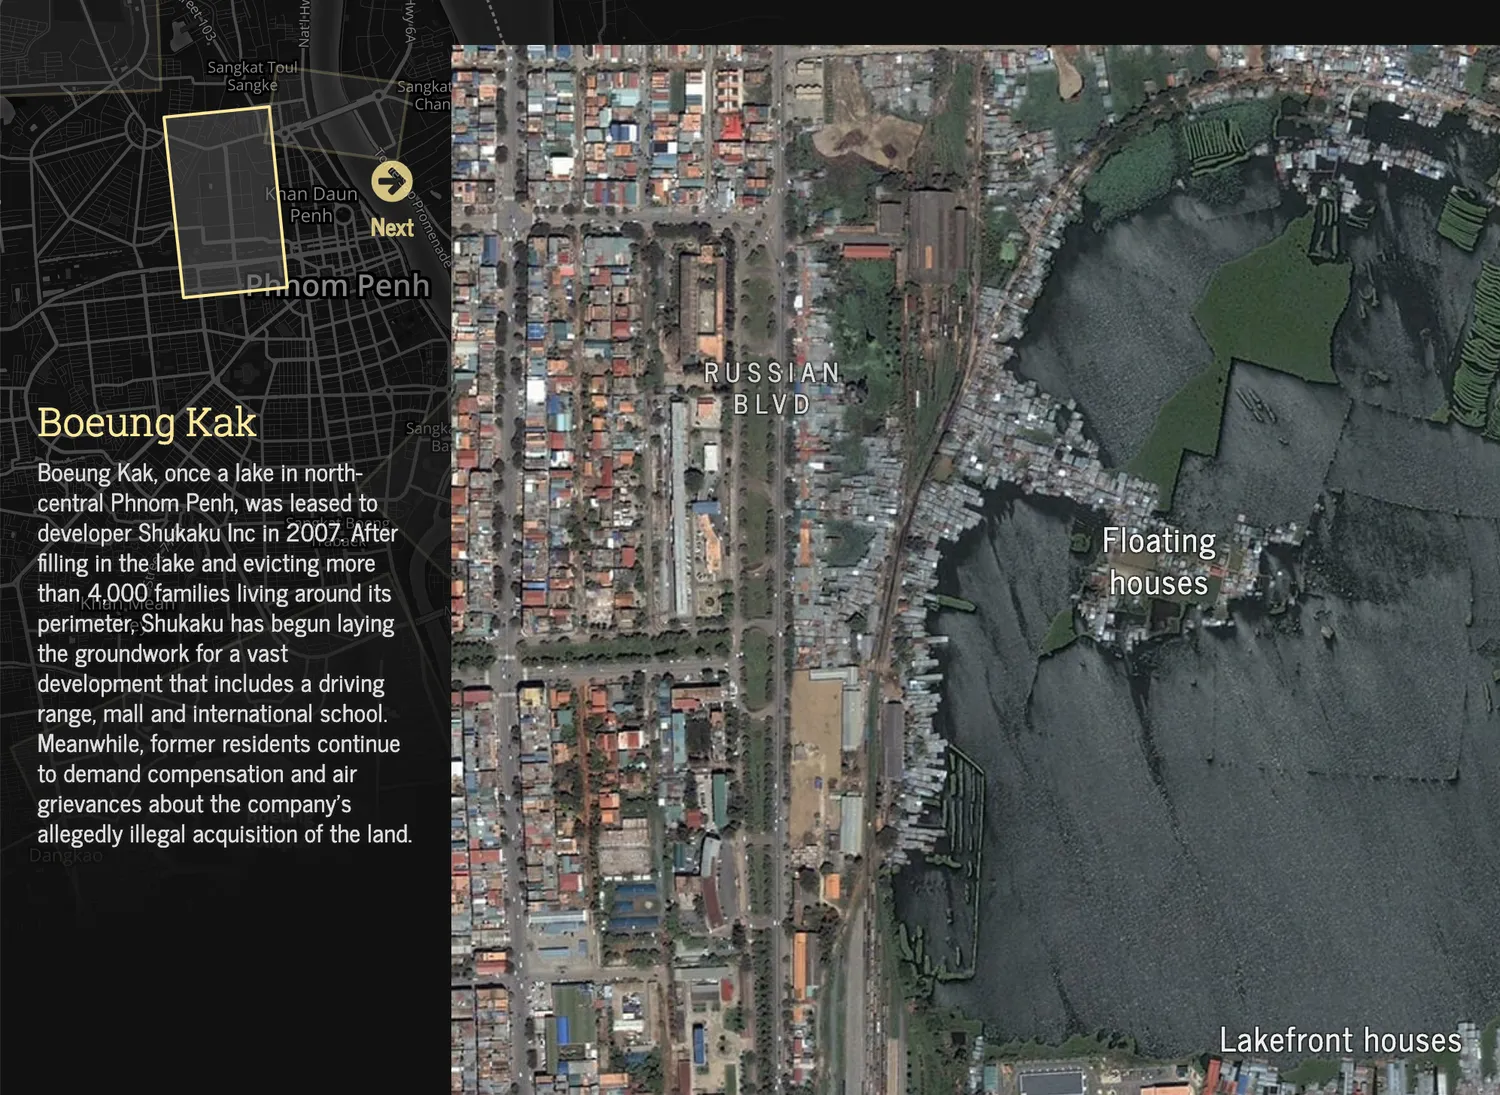
The Phnom Penh Post
The Changing Face of Phnom Penh
Mapbox
Design
Development
Mapping
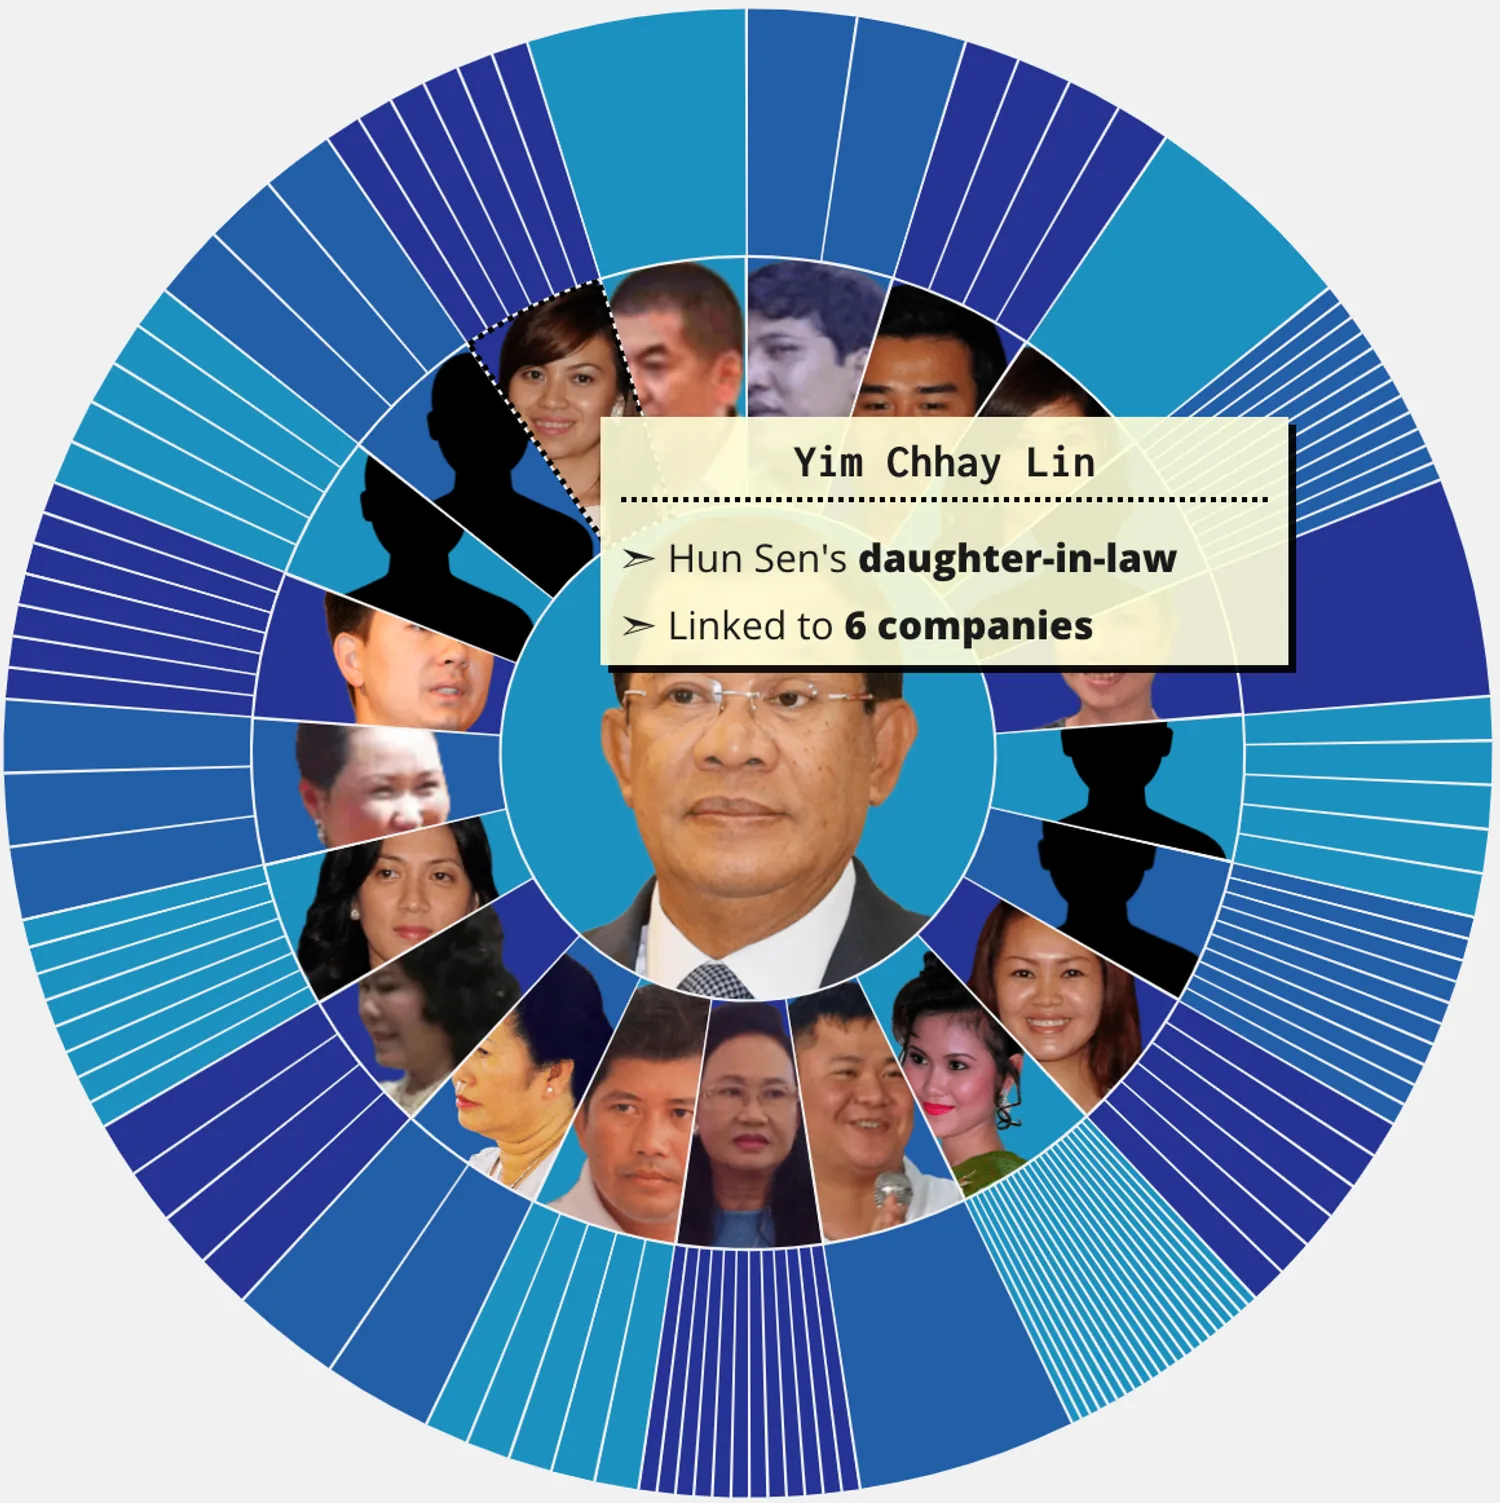
The Phnom Penh Post
Explore the Hun family’s business empire
D3
Dataviz
Design
Development
Awards and recognition
- 2025 Canadian Online Publishing Awards Best Continuing Coverage of a Story
- 2024 Anthem Awards Human & Civil Rights – Service (Silver)
- 2024 LION Sustainability Awards Product of the Year
- 2023 RTDNA Canada Awards Excellence in Innovation
- 2023 Digital Publishing Awards Best Digital Design (Honorable mention)
- 2022 Driehaus Foundation Awards Small Newsroom Category (Runner-up)
- 2022 Peter Lisagor Awards Best Investigative or In-Depth Reporting
- 2019 Data Journalism Awards Best News Data App (Shortlist)
- 2018 Deadline Club Awards Best Reporting by Independent Digital Media